|  Video
Animations Video
Animations
|
 |
|
 |
|
 |
|
 |
| View virtual fly-throughs of the Submarine Ring of Fire 2006: Mariana Arc Dive sites. |
|
 Slideshow of cruise maps and areas to be explored, Aegean and Black Sea 2006. Slideshow of cruise maps and areas to be explored, Aegean and Black Sea 2006.
|
|
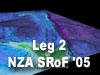
View the slide show of 3D images from the NZASRoF05 Leg 2 expedition dive sites. |
|
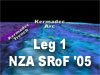
View the slide show of 3D images from the NZASRoF05 Leg 1 expedition dive sites. |
|
|
|
|
|
|
|
 |
|
 |
|
 |
|
 |
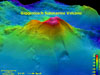
| Explore the volcanoes of the New Zealand American Submarine Ring of Fire 2005 (NZA SRoF '05) expedition. |
|
The second leg of the NZASRoF'05 expedition will depart from Tauranga, New Zealand. |
|
The first leg of the NZA SROF'05 expedition will depart from Pago Pago, American Samoa. |
|
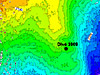
This movie shows a three-dimensional perspective and fly-through of the seafloor of the Bransfield Strait. |
|
|
|
|
|
|
|
 |
|
 |
|
 |
|
 |
| View
multibeam bathymetry collected on the 2003 and 2004 Submarine Ring
of Fire expeditions |
|
See
the satellite and sonar survey animation of the Mariana Arc Volcanic
Chain |
|
Take
a trip to the sea floor of the Mariana Arc! |
|
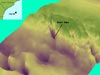
Fly
over the NW Uracas and Ahyi submarine volcanoes |
|
|
|
|
|
|
|
 |
|
 |
|
 |
|
 |
| Visit
the Mariana Arc virtual fly-throughs and panoramas of eight individual
sites. |
|
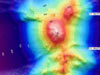
See
an animated fly through of the Bear Seamount, created using analyzed
multibeam data. |
|
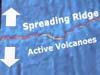
Mid-ocean
spreading center |
|
Mid-ocean
spreading center |
|
|
|
|
|
|
|
 |
|
 |
|
 |
|
 |
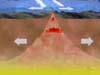
| Subduction
Zone plate boundary |
|
Subduction
Zone plate boundary |
|
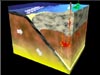
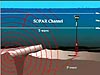
Hydrophone
animation |
|
3-D
rotation of Chapman's Reef |
|
 |
|
|
|
|
|
 |
|
 |
|
 |
|
 |
| Different
mapping sonar |
|
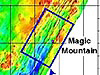
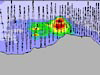
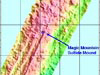
Magic
Mountain Virtual Site |
|
Mapping
by the SM2000 sonar system. |
|
Mapping
by ABE. |
|
|
|
|
|
|
|
 |
|
 |
|
|
|
 |
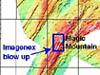
| Mapping
by the Imagenex sonar system |
|
Mapping
by the EM300 sonar system |
|
3-D
rotation of Chapman's Reef |
|
A
3-D flythrough was created from bathymetric data collected from
the Charleston Bump. |
|
|
|
|
|
|
|
 |
|
 |
|
|
|
|
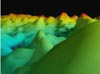
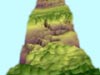
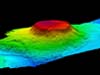
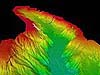
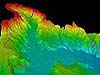
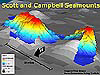
| Chains
of volcanic mountains. |
|
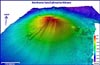
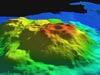
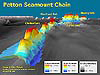
Patton
Seamount. |
|
|
|
|
|
|
|
|
|
|
|
| Images
|
|
|
|
|
|
|
|
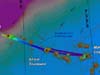
| Atlantic
|
 |
|
 |
|
 |
|
 |
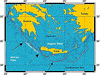
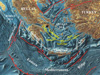
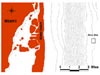
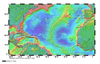
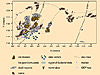
| The Cycladic Islands in the Aegean Sea, focus area for PHAEDRA 2006. |
|
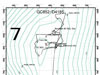
Simplified geotectonic map of Eastern Mediterranean and Aegean Sea. |
|
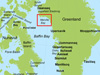
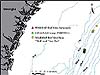
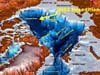
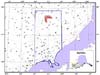
Map of West Greenland with Melville Bay shown in a red box. (HR) |
|
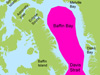
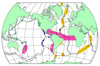
Narwhal wintering areas (pink) in Baffin Bay and Davis Strait. (HR) |
|
|
|
|
|
|
|
 |
|
 |
|
 |
|
 |
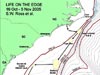
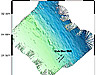
| Johnson-Sea-Link submersible dive sites during this expedition. (HR) |
|
Multibeam image of
Retriever and Pickett Seamounts. (HR) |
|
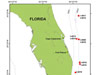
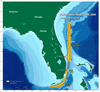
This map of the Florida Deep Coast Corals expedition route shows the the Florida straits. |
|
Map generated using ArcMap software giving an overview of the 2004 expedition. |
|
|
|
|
|
|
|
 |
|
 |
|
 |
|
 |
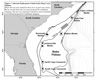
| Map of the southeastern US study area, illustrating proposed path of the cruise and various deep coral sampling areas. (HR) |
|
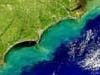
View of the Gulf Stream during summer off the southeastern United States. |
|
Bathymetry of the Lyman Seamount, shaded relief map. (HR) |
|
Bathymetry of the Milne-Edwards (western) and Verrill Seamounts (eastern), shaded relief map. |
|
|
|
|
|
|
|
 |
|
 |
|
 |
|
 |
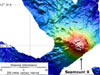
| This map shows the various peaks of the Corner Rise seamount cluster. |
|
This map shows the relative positions of the long New England seamount chain |
|
The North Atlantic Ocean distribution of the planktonic foraminifera N. pachyderma (sin) at the Last Glacial Maximum (LGM). |
|
Map of the entire track of the hotspot that formed the New England Seamounts and other associated volcanoes. |
|
|
|
|
|
|
|
 |
|
 |
|
 |
|
 |
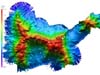
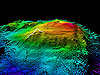
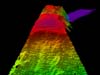
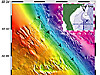
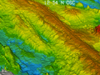
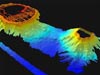
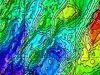
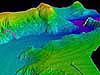
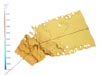
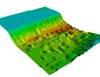
| 3-dimensional image derived from bathymetric data. |
|
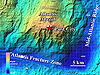
Perspective view of several massifs along the Atlantis Transform Fault. |
|
Perspective view of the Western Massif. |
|
The Mid-Atlantic Ridge hosts numerous hydrothermal fields (colored dots). |
|
|
|
|
|
|
|
 |
|
 |
|
 |
|
 |
| The Atlantis Massif or mountain is bounded to the east by the slow-spreading Mid-Atlantic Ridge. (HR) |
|
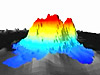
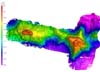
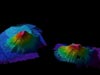
Multibeam map processed into three-dimensional image of Manning seamount complex. |
|
Multibeam image of Retriever and Pickett Seamounts. (HR) |
|
Mountains in the Sea 2004 course. |
|
|
|
|
|
|
|
 |
|
 |
|
 |
|
 |
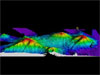
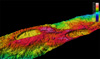
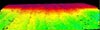
| Raw multibeam data for Bear Seamount. (HR) |
|
Multibeam image of Bear Seamount produced from data acquired with the Ronald H. Brown SeaBeam system. |
|
Map of the 13 dive sites in Estuary to the Abyss Expedition. |
|
Ship track of R/V Seward Johnson during the Estuaries to the Abyss expedition (HR) |
|
|
|
|
|
|
|
 |
|
 |
|
 |
|
 |
| Map of estuaries to the abyss expedition (HR) |
|
3-D visualization map of the Charleston Bump. |
|
Ocean topography off the southeast portion of the United States. |
|
A topographic representation of the sea floor around the Charleston Bump. |
|
|
|
|
|
|
|
 |
|
 |
|
 |
|
 |
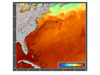
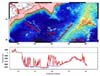
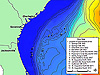
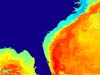
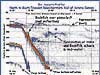
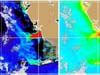
| Sea surface temperature readings. |
|
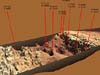
Scientists used multibeam bathymetric data to create a 3-D view of a portion of the Charleston Bump. |
|
Multibeam sonar map of the seamounts. |
|
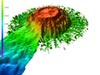
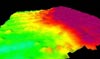
Flat-topped Bear Seamount. |
|
|
|
|
|
|
|
 |
|
 |
|
 |
|
 |
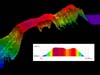
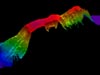
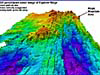
| A bathymetry map of the Kelvin seamount showing the Western ridge. |
|
Partial bathymetric image of Kelvin Seamount |
|
Partial bathymetry for Kelvin seamount. |
|
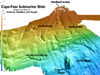
Map of the Cape Fear slide. |
|
|
|
|
|
|
|
 |
|
 |
|
 |
|
 |
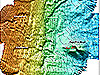
| Seabeam bathymetric map near the Cape Fear submarine slide and the Cape Fear salt diapir. |
|
Seabeam survey of the Blake Ridge Diapir. |
|
Map of the Blake Ridge Diapir. |
|
Seabeam survey of the northeastern flank (side) of Blake Ridge. |
|
|
|
|
|
|
|
 |
|
 |
|
 |
|
 |
| Bathymetric location map of the Blake Ridge study area. |
|
Nezumia foraging along the edge of a basalt outcrop. |
|
Computer monitor display showing the ship's position and track in real time. |
|
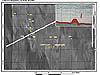
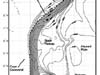
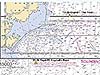
Detailed chart of the “Steeples” research site. |
|
|
|
|
|
|
|
 |
|
 |
|
 |
|
 |
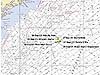
| Cruise planning chart of research areas. |
|
Hi resolution bathymetry of Blake Ridge |
|
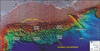
The northeasterly flow of the Gulf Stream |
|
Bathymetry of Blake Ridge |
|
|
|
|
|
|
|
 |
|
 |
|
 |
|
 |
| Bear Seamount |
|
Charleston Bump |
|
Sites studied at the North Carolina Shelf |
|
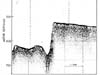
Sonar trace of wreckfish scarp |
|
|
|
|
|
|
|
 |
|
 |
|
 |
|
 |
| Side scan sonar image at Eau Gallie |
|
Fathometer reading at Eau Gallie |
|
Planned activities at Savannah Scarp |
|
Bathymetry of the New York-New Jersey region |
|
|
|
|
|
|
|
 |
|
 |
|
 |
|
 |
| The Charleston Bump |
|
Charleston Bump digital terrain model |
|
Southeast coast bathymetry |
|
Oculina Bank dive locations |
|
|
|
|
|
|
|
 |
|
 |
|
 |
|
 |
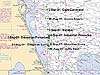
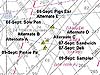
| Savannah Scarp locator map |
|
DWD-106 sewage sludge dumpsite |
|
Population density of the eastern US |
|
North Carolina Continental Shelf dive locations |
|
|
|
|
|
|
|
 |
|
 |
|
 |
|
 |
| Locator map for the Charleston Bump |
|
Charleston Bump dive
locations |
|
Savannah Scarp dive locations |
|
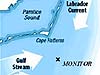
Sunken USS Monitor Map |
|
|
|
|
|
|
|
 |
|
 |
|
 |
|
|
| Cape Hatteras |
|
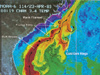
Sea surface temperature map |
|
Florida Current |
|
|
|
|
|
|
|
|
|
|
|
|
|
|
|
|
|
|
|
|
|
|
|
|
| |
|
|
|
|
|
|
|
|
|
|
|
|
|
|
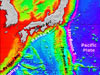
| Pacific
|
 |
|
 |
|
 |
|
 |
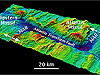
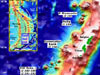
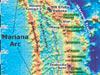
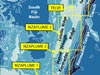
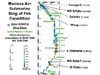
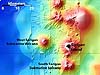
| The northern Mariana Arc submarine volcanoes visited on the SRoF'06 expedition. (HR) |
|
The southern Mariana Arc submarine volcanoes visited on the SRoF'06 expedition. (HR) |
|
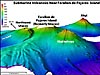
Map of the summit of Ruby volcano, the area of dive J2-194. |
|
Map showing the location and topography of Seamount X and Forecast. (HR) |
|
|
|
|
|
|
|
 |
|
 |
|
 |
|
 |
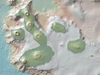
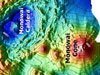
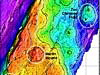
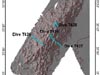
| Map of two peaks on the NE end of Davidson Seamount. |
|
Northwest Pacific from Guam to Iwo Jima. (HR) |
|
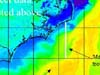
Satellite altimetry data of the western Pacific from the equator to Japan. (HR) |
|
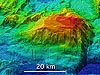
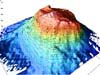
Davidson Seamount off the coast of central California, USA. |
|
|
|
|
|
|
|
 |
|
 |
|
 |
|
 |
| ROV Tiburon tracklines of the 2002 expedition to Davidson Seamount, with coral locations. |
|
The relationship of Davidson Seamount to Monterey Bay and the coast. |
|
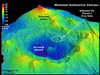
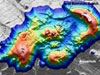
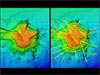
The recently collected EM-300 data revealed these two back-to-back calderas. (HR) |
|
This bathymetric map created using the EM-300 multibeam sonar shows the ridge crest at 4 times greater resolution than previous maps. (HR) |
|
|
|
|
|
|
|
 |
|
 |
|
 |
|
 |
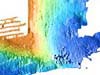
| This low-resolution bathymetric map shows us the average seafloor depth of a 200m square area. (HR) |
|
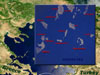
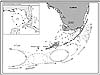
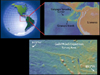
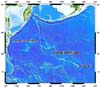
GalAPAGoS Expedition survey area lies within the red box shown on the globe at upper left. |
|
Bathymetric image of the East Pacific Rise. |
|
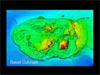
An overview of the Galapagos Islands. |
|
|
|
|
|
|
|
 |
|
 |
|
 |
|
 |
| Emperor Seamount chain stretching more than 6000 km in the Pacific Ocean. |
|
An overall image of the New Zealand American Submarine Ring of Fire 2005 expedition dive sites. (HR) |
|
Map view of Brothers submarine volcano. |
|
Map view of Rumble V submarine volcano. |
|
|
|
|
|
|
|
 |
|
 |
|
 |
|
 |
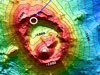
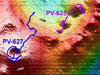
| Healy submarine volcano with Pisces V dive tracks (PV-625 and PV-627) overlaid on the bathymetry. |
|
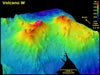
Map view of submarine Volcano-W. |
|
Giggenbach submarine volcano viewed from the east looking west. |
|
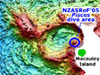
Map view of Macauley and Giggenbach submarine volcanoes. |
|
|
|
|
|
|
|
 |
|
 |
|
 |
|
 |
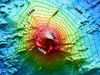
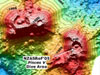
| Map view of Monowai submarine volcano, featuring the cone in the south-southwest and the caldera to the northeast. (HR) |
|
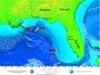
Southwest Pacific from Samoa (northeast) to New Zealand (southwest). |
|
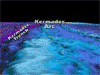
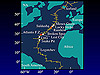
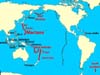
Location map for the Kermadec-Tonga Arc, showing the study areas covered by four cruises since 1999. |
|
Two-dimensional map view of submarine Volcano-W. |
|
|
|
|
|
|
|
 |
|
 |
|
 |
|
 |
| An overall image of
the Submarine Ring of Fire 2004 expedition. (HR) |
|
A perspective view
of several eruption cones inside the East Diamante caldera. (HR) |
|
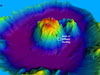
Three-dimensional
view of the Maug caldera (2 times vertical exaggeration). (HR) |
|
The summit of Diamante
volcano, created from an EM300 grid. (HR) |
|
|
|
|
|
|
|
 |
|
 |
|
 |
|
 |
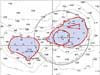
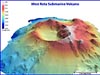
| A comparison of Crater
Lake and West Rota calderas. (HR) |
|
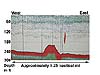
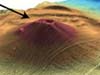
A cross-section of
NW Rota 1 measured by an optical turbidity sensor mounted on a
CTD package. |
|
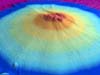
NW Rota 1 EM300 bathymetry. |
|
Preliminary soundings
near Lisianski Island. |
|
|
|
|
|
|
|
 |
|
 |
|
 |
|
 |
| Newly surveyed data
around Maro Reef. |
|
3-D view Lisianski
Island data. |
|
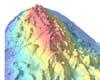
A digital terrain
model of a seamount. |
|
A backscatter mosaic. |
|
|
|
|
|
|
|
 |
|
 |
|
 |
|
 |
| Multibeam data of
Nihoa Island. |
|
Bathymetry of the
French Frigate Shoals. |
|
Nihoa Island nautical
chart. |
|
Seabeam map of the
south and east banks of the eastern Northampton Seamount. |
|
|
|
|
|
|
|
 |
|
 |
|
 |
|
 |
| Bathymetry data collected
at the Mariana Arc (HR) |
|
Bathymetry of three
volcanoes (HR) |
|
Bathymetry of West
Rota submarine volcano (HR) |
|
Kasuga 1 submarine
volcano (HR) |
|
|
|
|
|
|
|
 |
|
 |
|
 |
|
 |
| Nikko submarine volcano
(HR) |
|
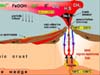
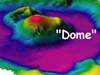
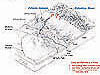
Venting system on
a submarine arc volcano (HR) |
|
Location of the CTD
cast in the Maug caldera (HR) |
|
Plumes near East Diamante
volcano (HR) |
|
|
|
|
|
|
|
 |
|
 |
|
 |
|
 |
| East Diamante and
Sarigan submarine volcanoes map (HR) |
|
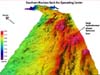
Southern Mariana back-arc
spreading center (HR) |
|
Location of hydrothermal
vent fields (HR) |
|
Northwest Rota submarine
volcano (HR) |
|
|
|
|
|
|
|
 |
|
 |
|
 |
|
 |
| Pencil-beam sonar
image of Magic Mountain hydrothermal site. (HR) |
|
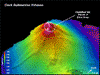
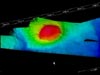
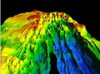
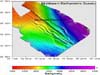
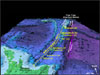
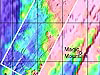
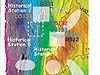
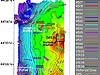
Bathymetric map of
Magic Mountain area. (HR) |
|
SM300 multibeam bathymetry
collected at Explorer Ridge. (HR) |
|
Pencil-beam bathymetry
of Magic Mountain area. (HR) |
|
|
|
|
|
|
|
 |
|
 |
|
 |
|
 |
| SM2000 multibeam bathymetry
of Magic Mountain area. (HR) |
|
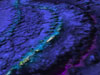
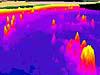
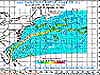
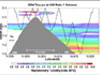
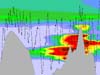
Transect showing particle
cloud over Magic Mountain vent site. (HR) |
|
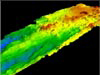
Magnetization map
of Explorer Ridge. (HR) |
|
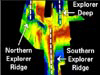
Bathymetric map of
Explorer Ridge. (HR) |
|
|
|
|
|
|
|
 |
|
 |
|
 |
|
 |
| Particle intensity
map of Explorer Ridge. (HR) |
|
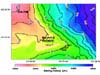
Temperature map of
Explorer Ridge region. (HR) |
|
Map of chemically
reactive water from vent sources. (HR) |
|
High resolution bathymetry
collected on ABE's first two dives. (HR) |
|
|
|
|
|
|
|
 |
|
 |
|
 |
|
 |
| Cross-section of a
hydrothermal plume over Magic Mountain. (HR) |
|
EM300 bathymetry survey
over Explorer Ridge. (HR) |
|
This map shows a wildlife
transect . |
|
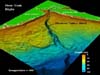
Contour map of Davidson
Seamount and dive tracks. |
|
|
|
|
|
|
|
 |
|
 |
|
 |
|
 |
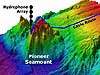
| Pioneer Seamount map
depicting submarine cable |
|
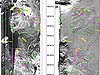
Locations of blue
whales |
|
Pioneer Seamount Cable |
|
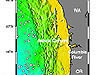
Multibeam bathymetry
of Heceta Bank |
|
|
|
|
|
|
|
 |
|
 |
|
 |
|
 |
| Heceta Bank backscatter
and topography |
|
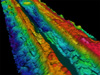
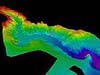
Side-lit multibeam
bathymetry of Heceta Bank |
|
3-D image of Astoria
canyon, looking southeast |
|
Head of Astoria Canyon,
looking east |
|
|
|
|
|
|
|
 |
|
 |
|
 |
|
 |
| Astoria Canyon, looking
southwest |
|
Astoria Canyon, looking
east from mid-canyon |
|
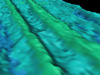
3-D maps of Heceta
Bank |
|
Data from the bioacoustic
profiler |
|
|
|
|
|
|
|
 |
|
 |
|
 |
|
 |
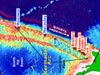
| ROPOS Dive Tract |
|
Submersible dives
conducted around Heceta Bank |
|
Historical 3-D map
of Astoria Canyon |
|
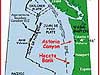
Astoria Canyon and
Heceta Bank |
|
|
|
|
|
|
|
 |
|
 |
|
 |
|
|
| Bathymetry and Earthquakes |
|
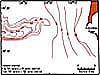
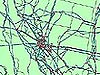
Astoria Canyon contours |
|
Atoll from space |
|
|
| |
|
|
|
|
|
|
|
|
|
|
|
|
|
|
| Gulf
of Mexico
|
 |
|
 |
|
 |
|
 |
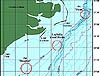
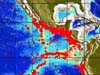
| This map shows the ALVIN dive track along the seafloor. |
|
The colors on this reflectivity map describe the hardness of the seafloor surface. |
|
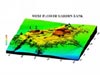
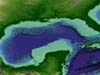
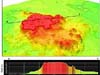
A computer enhanced multibeam bathymetry map of the northwestern and northern Gulf of Mexico continental shelf and slope. |
|
Map of the northern Gulf of Mexico showing the nearly 4,000 active oil and gas platforms. (HR) |
|
|
|
|
|
|
|
 |
|
 |
|
 |
|
 |
| Bathymetric map of the Gulf of Mexico, with proposed dive sites for Operation Deep-Scope 2005 indicated by red arrows and yellow numbers. |
|
The approximate route of the NOAA Ship Ronald H. Brown during the NW Gulf of Mexico cruise. (HR) |
|
Seabeam image of bathymetry at Diaphus Bank. |
|
Oblique view of WFGB, looking northward. |
|
|
|
|
|
|
|
 |
|
 |
|
 |
|
 |
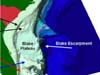
| A seafloor map of Alderdice Bank. |
|
Alderdice Bank features two towers of basalt. (HR) |
|
Bright Bank, and underwater salt dome on the continental shelf of the Gulf of Mexico |
|
Multibeam image of Mullins Lithoherm. |
|
|
|
|
|
|
|
 |
|
 |
|
 |
|
 |
| 3-D multibeam image of the Westward view of “Forcepia-land” escarpment. |
|
3-D multibeam image of the Northward view of “Forcepia-land” escarpment. |
|
Gulf of Mexico gyre. |
|
3D map of Gulf of Mexico. |
|
|
|
|
|
|
|
 |
|
 |
|
 |
|
 |
| Gulf of Mexico gyre. |
|
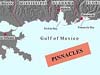
Locator map for Pinnacles area |
|
Relief map of Yellowtail Reef in Pinnacles area |
|
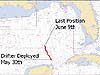
Drifter map |
|
|
|
|
|
|
|
 |
|
|
|
|
|
|
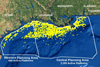
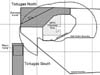
| Tortugas Ecological Reserve Location Map |
|
|
|
|
|
|
| |
|
|
|
|
|
|
|
|
|
|
|
|
|
|
| Alaska
|
 |
|
 |
|
 |
|
 |
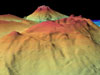
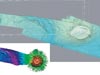
| A 3-D perspective
generated from our bathymetric mapping of Giacomini (right) and
Ely (left). |
|
A multibeam image
of Ely Seamount; the caldera is visible at the apex of the seamount.
(HR) |
|
Multibeam image of
Denson Seamount, looking approximately NW. (HR) |
|
The Swan Surveyor
depicting the R/V Atlantis (far right) mapping a section
of the ocean floor. (HR) |
|
|
|
|
|
|
|
 |
|
 |
|
 |
|
 |
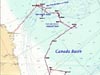
| Arctic Expedition
map. |
|
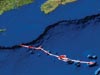
Map of the Louis’ track
and CTD casts. |
|
2002 Arctic Exploration
cruise track. |
|
Bristol Bay study
area |
|
|
|
|
|
|
|
 |
|
 |
|
|
|
|
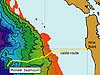
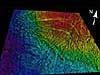
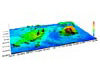
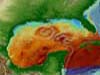
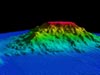
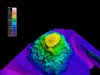
| Patton Seamount chain |
|
Seabeam bathymetry. |
|
|
|
|
| |
|
|
|
|
|
|
|
|
|
|
|
|
|
|
| World
|
 |
|
 |
|
 |
|
 |
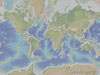
| Map of the world�s ocean showing target areas for Biogeography of Chemosynthetic Ecosystems research. |
|
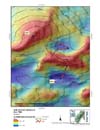
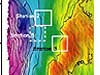
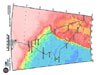
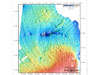
Bathymetric map showing a global view of the mid-ocean ridge (MOR). |
|
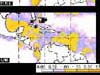
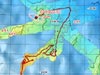
Map of the Earth indicating boundaries. |
|
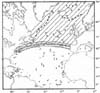
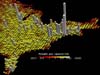
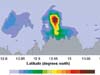
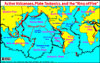
Active volcanoes (red dots) define the Pacific Ring of Fire where they form along tectonic plate boundaries. |
|
|
|
|
|
|
|
 |
|
 |
|
 |
|
 |
| Distribution of active
marine volcanic arcs (HR) |
|
Current and potential
hydrophone sites |
|
Earthquakes detected
by the autonomous array |
|
"Empty" GIS
Globe |
|
|
|
|
|
|
|
 |
|
 |
|
 |
|
|
| Globe filled with
GIS data |
|
GOES View |
|
Coral bleaching |
|
|
| |
|
|
|
|
|
|
|
|
|
|
|
|
|
|
| Other
|
 |
|
 |
|
 |
|
 |
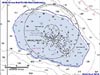
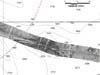
| Bathymetric map showing the station locations and cruise track of the USCGC Healy during the Hidden Ocean expedition. (HR) |
|
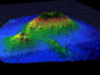
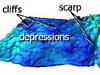
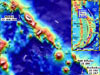
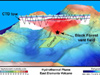
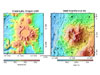
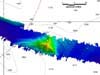
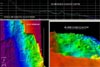
A multibeam map of the seafloor shows deep depressions, or pockmarks, in dark blue. |
|
Multibeam image displaying sonar data collected by Healy's data acquisition system. |
|
Three-dimensional perspective of the seafloor of the Bransfield Strait. |
|
|
|
|
|
|
|
 |
|
 |
|
 |
|
 |
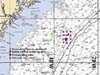
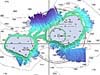
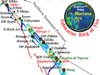
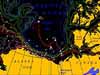
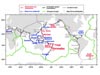
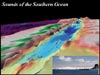
| The geographic names of the study area that were the focus of the Sounds of the Southern Ocean expedition. |
|
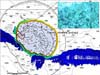
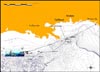
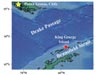
The research group will fly via Chilean C-130 from Punta Arenas to King George Island. |
|
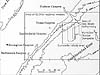
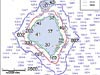
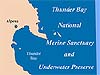
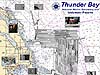
Thunder Bay map |
|
Thunder Bay map with side scan sonar tracklines |
|
|
|
|
|
|
|
 |
|
 |
|
 |
|
 |
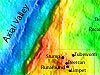
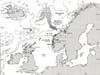
| The Norwegian and North Sea |
|
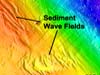
Image of Storegga slide |
|
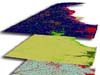
GIS layers |
|
Vector data |
|
|
|
|
|
|
|
 |
|
 |
|
|
|
|
| Raster data |
|
Algal bloom monitoring |
|
|
|
|
|
|
|
|
|
|
|


