

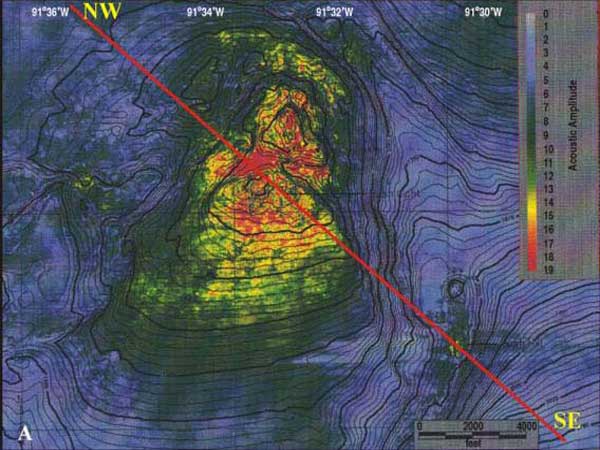
The colors on this reflectivity map describe the hardness of the sea-floor surface. Blue represents soft bottom, such as silt or mud, which is the most common bottom type in the Gulf of Mexico. Scientists on Expedition to the Deep Slope are primarily interested in the yellow and red areas, the hardbottom. Image courtesy of Harry Roberts, LSU.