by Professor James Holden, Ph.D., University of Massachusetts Amherst
June 27, 2010
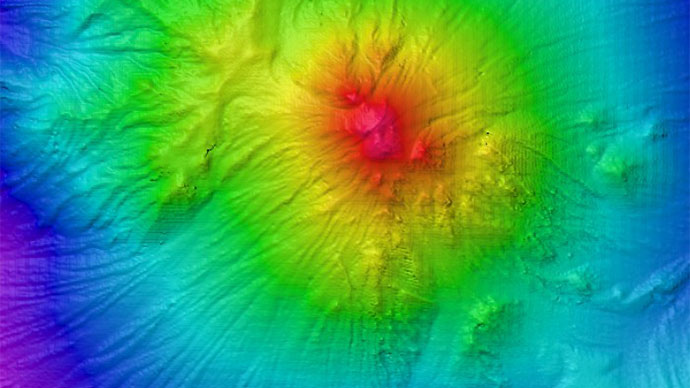
. Areas of interest can be explored in greater detail by collecting data to create more detailed maps, like the one to the left showing multibeam data acquired by Okeanos Explorer.")
Image showing a map of the INDEX-SATAL 2010 operating area made using data from a satellite in space that can reveal features like large submarine volcanoes and ocean trenches (right). Areas of interest can be explored in greater detail by collecting data to create more detailed maps, like the one to the left showing multibeam data acquired via NOAA Ship Okeanos Explorer. Image courtesy of the NOAA Office of Ocean Exploration and Research, INDEX-SATAL 2010. Download larger version (jpg, 422 KB).
One of the primary goals of this expedition is to discover and explore new deep-sea hydrothermal vent ecosystems – located in places where seawater is heated deep within the crust near a magma source and then shoots out of the seafloor as jets of fluid up to 400°C (750°F). The question is, “how do you discover these sites (which exist in complete darkness and may fit inside a gymnasium) over the broad expanse of the ocean?”
First, we look at a map of the entire global ocean seafloor that was made using a satellite in space. The resolution of this map is good enough to pick out features like large submarine volcanoes and ocean trenches. Once we find an area of interest, then we can begin looking at that region in more detail.
For this expedition, we chose a region just north of Sulawesi Island in Indonesia along a volcanic line of islands known as the Sangihe arc. Many of these islands have active volcanoes that have erupted within the last 50 years. The satellite map showed that there are volcanoes below the surface on the west side of this arc. In 2001, Indonesian and Australian scientists surveyed these underwater volcanoes and found evidence of hydrothermal activity using instruments lowered from a ship, but they lacked the ability to explore the seafloor with a remotely operated vehicle (ROV) and find the sources of the venting.
We are making a more detailed seafloor map of a 2,400-square-mile area west of the Sangihe arc using a high-precision sonar device on board NOAA Ship Okeanos Explorer – EM302 multibeam sonar. This sonar allows us to see in more detail what the seafloor looks like and identify features of interest, including those that we think are volcanically active.

Bathymetric image of Kawio Barat volcano created with data acquired during INDEX-SATAL 2010. The white dots on the map represent locations where CTD casts were conducted to look for the presence of hydrothermal plumes. Using data collected with the CTD and a detailed bathymetric map, scientists can choose ROV dive locations to take a closer look and hopefully make exciting discoveries! Image courtesy of the NOAA Office of Ocean Exploration and Research, INDEX-SATAL 2010. Download image (jpg, 47 KB).
On this expedition, we are very interested in one particular deep-sea volcano named Kawio Barat. Our mapping has shown that this is a smooth conical volcano that rises more than 3,350 meters (11,000 feet) from a point more than 5,490 meters (18,000 feet) below the surface. The top of this volcano is about 2,130 meters (7,000 feet) below the surface.
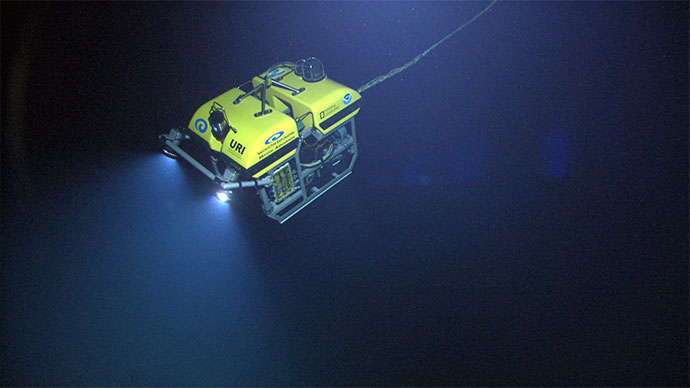
The next step is to look for evidence of these super-heated jets of fluid coming out of the volcano. Often these fluids contain a lot of metallic particles that were extracted from the rock. These fluids look a lot like smoke from a fire on land and are called a ‘plume.’ They rise upward a few hundred feet and then drift away horizontally in the direction of the ocean current. We lower an instrument called a CTD rosette over the side of the ship down to the top of these volcanoes to look for very small increases in temperature and particle concentration and small changes in the oxidation-reduction potential as an indication of these hydrothermal plumes. With skill, we can follow the plumes down to their source on the seafloor, which is where we find the interesting life and mineral structures associated with hydrothermal vents. With this information, we can know where to send our ROV to make exciting discoveries!

An instrument called a CTD rosette is lowered down to the top of these volcanoes to measure the salinity, temperature, depth, and concentration of particles in the water column. Scientists use particle concentration and Oxygen Reduction Potential as the most sensitive indicators of hydrothermal plumes. Image courtesy of the NOAA Office of Ocean Exploration and Research, INDEX-SATAL 2010. Download image (jpg, 171 KB).
 sensor and Oxygen Reduction Potential (ORP) data, versus time, acquired by the CTD/rosette as it passed through a plume overtop of Kawio Barat volcano. There was an intense particle anomaly and ORP decrease in the bottom 30 meters of the water column when the plume was encountered. A drop in the ORP, like you see here, means that there are more electron donor compounds in the water produced by enrichment of seawater in dissolved metals and chemicals billowing out of hydrothermal vents. The ORP values begin to increase again, recovering slowly, when the CTD leaves the plume.")
Plot showing light scattering (dNTU) sensor and Oxygen Reduction Potential (ORP) data, versus time, acquired by the CTD rosette as it passed through a plume overtop of Kawio Barat volcano. There was an intense particle anomaly and ORP decrease in the bottom 30 meters of the water column when the plume was encountered. A drop in the ORP, like you see here, means that there are more electron donor compounds in the water produced by enrichment of seawater in dissolved metals and chemicals billowing out of hydrothermal vents. The ORP values begin to increase again, recovering slowly, when the CTD leaves the plume. Image courtesy of Sharon Walker, PMEL. Download larger version (jpg, 2 MB).