by Mashkoor Malik and Elizabeth Lobecker, Physical Scientists, NOAA Office of Ocean Exploration and Research
Elaine Stuart and Colleen Peters, Senior Survey Technicians, NOAA Ship Okeanos Explorer
Nicola Verplanck, Operations Officer, NOAA Ship Okeanos Explorer
June 26, 2010
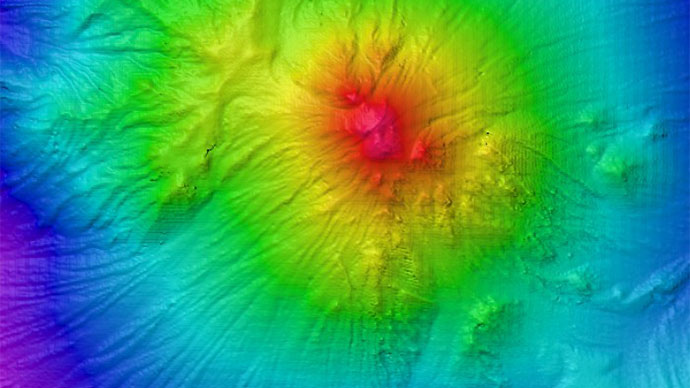
 seamount looking from the northwest. The underwater volcano rises around 3800 meters from the seafloor.")
This is a perspective view of the Kawio Barat (West Kawio) seamount looking from the northwest. The underwater volcano rises around 3,800 meters (12,467 feet) from the seafloor. Image courtesy of the NOAA Office of Ocean Exploration and Research, INDEX-SATAL 2010. Download larger version (jpg, 574 KB).
June 24 marked the start of the first expedition where all of the sensors on NOAA Ship Okeanos Explorer will work in unison to explore unknown depths in Indonesian waters. The hull-mounted multibeam sonar (Kongsberg EM302, 30 kHz) will be used to collect data to produce baseline bathymetric maps, which ocean scientists – including marine geologists, biologists, oceanographers, and ecologists – will use as a backdrop to study the seafloor. Kawio Barat was one of the first underwater seamounts mapped during this cruise. The impressive volcano rises some 3,800 meters (12,467 feet) above the surrounding seafloor. Images from mapping results over Kawio Barat were shared with scientists based in Jakarta and Seattle in real time, from which CTD cast sites and remotely operated vehicle (ROV) dive sites will be selected.
The Okeanos Explorer’s multibeam mapping system was the first major sensor to be tested after the ship was commissioned on August 13, 2008. During 2009, the ship continued mapping operations off of the U.S. West Coast and Islands of Hawaii, mapping a total of 40,104 linear kilometers, which is equivalent to travelling one time around the Earth. A total of 169,108 square kilometers (65,292 square miles) of the ocean floor was mapped during the 2008-2009 field season, which is roughly the size of the State of Wisconsin.

An overview of the multibeam data collected during the 2008-2009 field season off of the West Coast of the United States as well as in the vicinity of the Hawaiian Islands. In size, this area is comparable to the State of Wisconsin. Image courtesy of the NOAA Office of Ocean Exploration and Research, INDEX-SATAL 2010. Download larger version (jpg, 553 KB).
The sonar is capable of probing depths down to seven kilometers and provides up to eight kilometers of swath coverage. This means that with each ping of the sonar, up to eight kilometers of the seafloor is mapped to a very high resolution. The multibeam data collected served a multitude of purposes and will continue to do so in coming years for disciplines varying from marine sanctuary management to marine law and plate tectonics to marine archaeology.
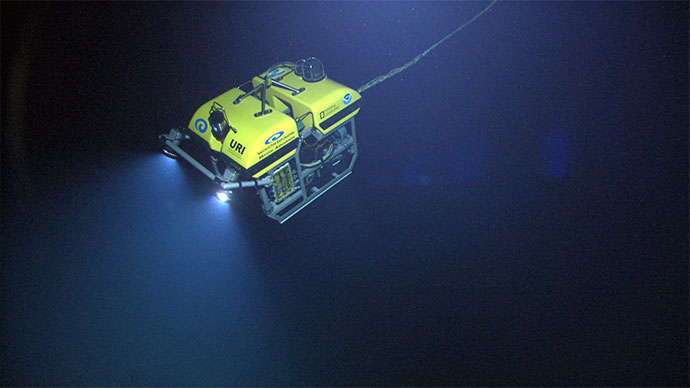
As the ship moves into the 2010 field season, the excitement of exploration is threefold. Not only can the multibeam system provide a detailed bathymetric image of the seafloor, but now the ship is equipped to take the seafloor exploration to the next level with the onboard ROV, Little Hercules.
ROV dive sites and geological targets are first selected from the high-resolution maps generated with the multibeam data. The ROV then dives on these targets and provides high-definition images and video of the mysterious seafloor. The quality of the video coming from the Little Hercules cameras is equivalent to the technology used to film the NFL Superbowl! With telepresence capabilities onboard the ship, we can then share the results of exploration in real time with scientists on shore.

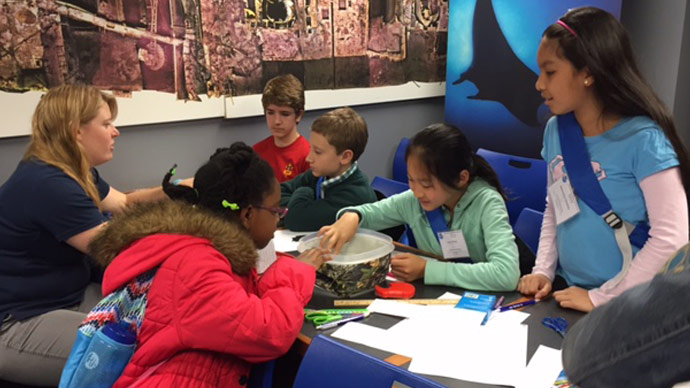
There is a lot of information to keep track of when standing watch at the multibeam acquisition station. Each piece of information provides unique and valuable details about the seafloor, which are all used in the exploration decision-making process. Image courtesy of the NOAA Office of Ocean Exploration and Research, INDEX-SATAL 2010. Download larger version (jpg, 990 KB).