2021 North Atlantic Stepping Stones: New England and Corner Rise Seamounts
Mapping and Diving Go Together Like Peanut Butter and Jelly
Shannon Hoy, Mapping Expedition Lead, NOAA Ocean Exploration
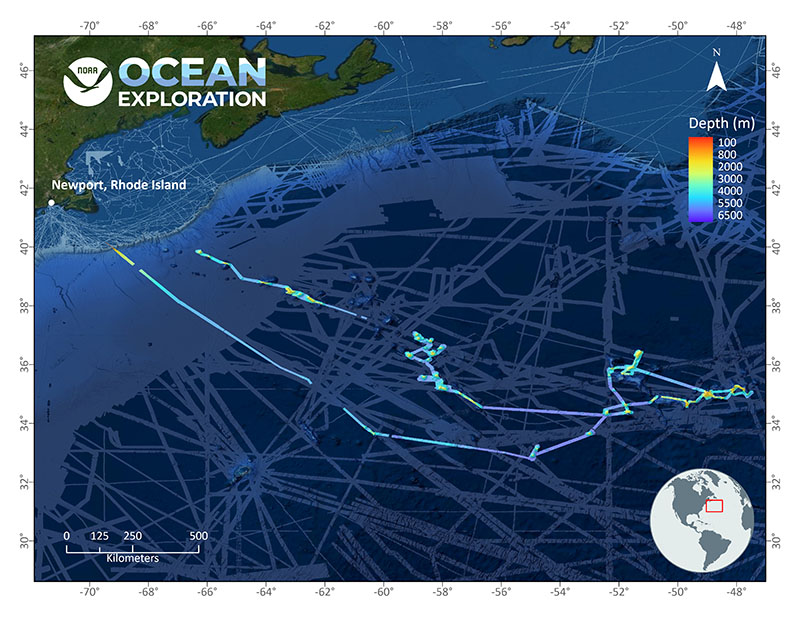
You likely know that during remotely operated vehicle (ROV) expeditions there are two main operations occurring, generally ROV dives during the day and mapping the seafloor overnight. But did you know that these operations are strongly linked? Effective planning of ROV dives for both scientific objectives and safe navigation of the vehicles is dependent on high-quality seafloor maps. Sometimes the seafloor data are collected well before the ROV expedition, but other times we operate in remote areas where little previous mapping efforts have occured. The latter describes the majority of the operational area for the 2021 North Atlantic Stepping Stones: New England and Corner Rise Seamounts expedition (Figure 1).
Figure 1: Overview of seafloor data collected during the 2021 North Atlantic Stepping Stones: New England and Corner Rise Seamounts expedition (rainbow gradient), overlaid on the previously collected bathymetry data (blue gradient). Image courtesy of NOAA Ocean Exploration, 2021 North Atlantic Stepping Stones: New England and Corner Rise Seamounts. Download largest version (jpg, 6.2 MB).
Generally during this expedition, mapping operations that occurred overnight (or in most cases, during the early morning) were designed to map an area of interest for the following dive, which we call a “map and dive.” As is the nature with “map and dives,” there is a very quick turnaround from acquiring the seafloor data to using the maps to inform where to send the ROV. The mapping team typically only has a few minutes from when the ship gets on station in the morning to create the products necessary for scientific and operational decision-making.
So, what are the steps to decide where to go? Once the data have been collected, a mapping watch lead must quickly clean the data of outlier soundings. The cleaned data are gridded to produce a digital terrain model that can be viewed in three dimensions. The scientific and operational team then gathers to analyze the derived information and determine the optimal dive location based on scientific objectives and conditions that affect ROV operations, such as the terrain and prevailing surface currents. Seafloor morphology (shape), slope (steepness), and backscatter (relative hardness) are the main sources of information about the terrain that drive these conversations (Figure 2).
Figure 2: Dive planning products for Michael Seamount: bathymetry (left), slope (mid), backscatter (right). Image courtesy of NOAA Ocean Exploration, 2021 North Atlantic Stepping Stones: New England and Corner Rise Seamounts. Download largest version (jpg, 4.3 MB).
These early morning meetings of the minds are some of the most intense parts of my day as a mapping lead, and I thoroughly enjoy the rapidness with which we all must come together to provide our own unique expertise to figure out where best to explore, given the data that my team worked hard overnight to collect and process.
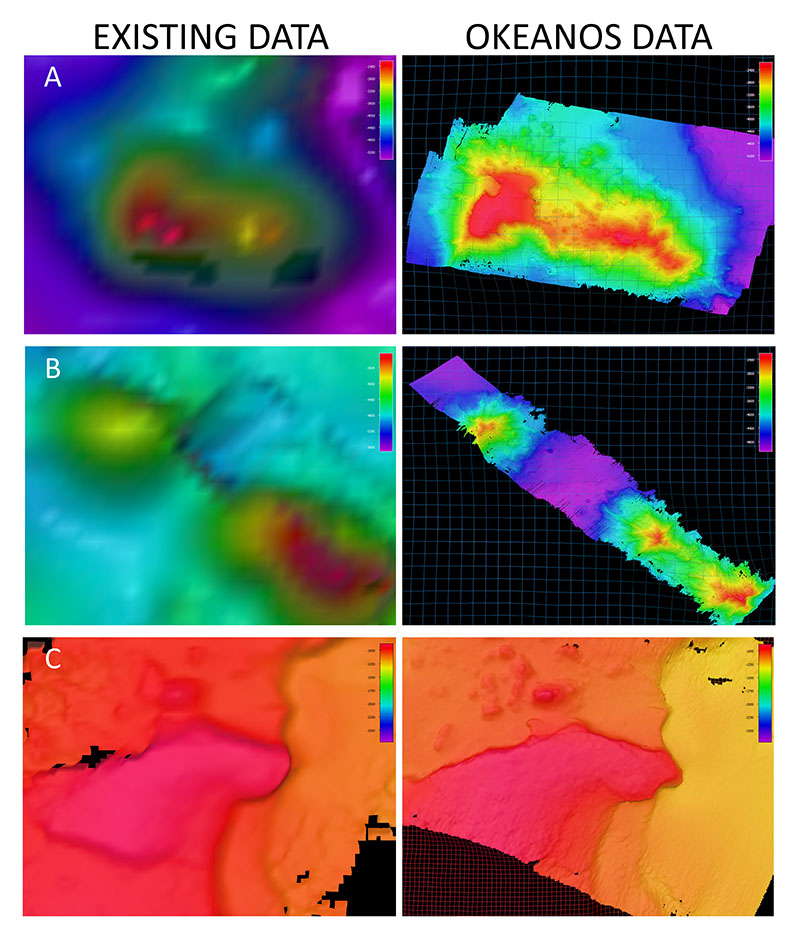
Fortunately, we are not operating completely blind prior to mapping an area. We do have some information about the seafloor from satellite altimetry and previous transects to focus our higher-resolution mapping efforts. It is always fascinating to see the differences we can uncover, especially during this expedition, as it was the first ROV mission with our state-of-the-art EM 304 MK II variant multibeam sonar.
Notable differences included discovering that satellite altimetry estimated a feature to be two seamounts when it was actually one (Figure 3-A), a new seamount not apparent in satellite altimetry data (Figure 3-B), and a significant difference in the nose of a feature from what was previously mapped during 2005 (Figure 3-C), all of which add to our understanding of the region. You may say “Hey, 2005 wasn’t that long ago. Why is there such a difference?” While 2005 was only 16 years ago, that is actually a significant amount of time in terms of how long multibeam sonar technology has been around, which is approximately 40 years (so nearly half of its life). The difference observed between these two datasets is likely due to the increased resolution capable from rapid advancements in technology.
Figure 3: Pre-existing data (left) compared to newly collected bathymetry data (right). Image courtesy of NOAA Ocean Exploration, 2021 North Atlantic Stepping Stones: New England and Corner Rise Seamounts. Download largest version (jpg, 3.9 MB).
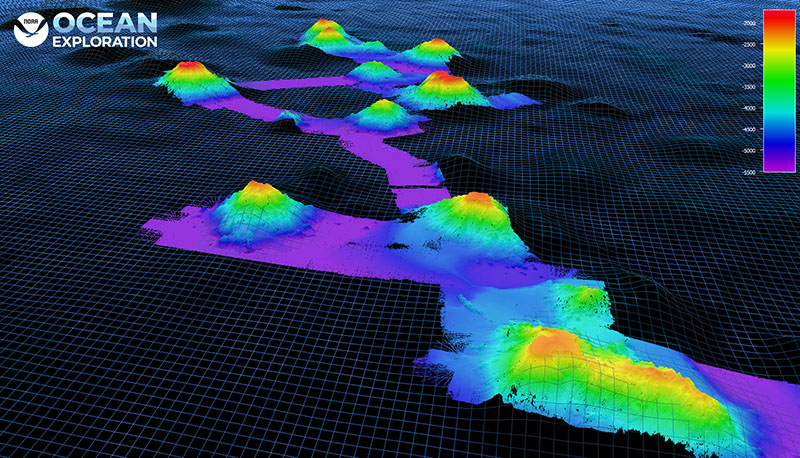
Throughout this expedition, we have mapped (to varying degrees) about 40 seamounts, 20 of which had little to no preexisting data (Figure 4), and performed 14 “map and dives.” In addition to creating maps to determine the optimal location for ROV dives, the mapping data collected during this expedition fill gaps in our collective understanding of the North Atlantic seamount chains.
New bathymetry data of the New England Seamounts collected with the EM 304 MK II variant during the 2021 North Atlantic Stepping Stones: New England and Corner Rise Seamount Chain (EX-21-04) expedition, overlaid on the Global Multi-Resolution Topography Data Synthesis grid. Image courtesy of NOAA Ocean Exploration, 2021 North Atlantic Stepping Stones: New England and Corner Rise Seamounts. Download largest version (jpg, 3.4 MB).
.


