By Gary Fabian, Independent Consultant to NOAA
Christopher Kelley, University of Hawaii
Searching for historic ship and aircraft wrecks in deep water should always begin with a thorough review of historic records in order to identify a search area. Once that crucial step has been completed, the next step is to identify viable targets within the search area that could potentially be what you’re looking for. A target is defined as any feature on the seafloor that looks interesting enough to be a wreck.
Identifying targets in deep water typically requires the use of two types of sonar systems. First, a hull-mounted multibeam sonar is used to survey the search area in order to create an overall image of the topography and substrate present, usually at 5 to 50-meter resolution. Once completed, this data can be used to design a higher-resolution survey using side scan sonar.
Unlike hulled-mounted multibeam systems, a side scan sonar is not attached directly to the hull, but rather is towed by a cable behind the ship very close to the bottom in order to provide near photographic quality images of the seafloor.

Figure 1: Side scan sonar image of an F6F Hellcat fighter plane (lower right) off Pearl Harbor, Oahu. Image courtesy of Christopher Kelley, University of Hawaii. Download larger version (jpg, 148 KB).
Targets are then selected from the side scan sonar data that are typically at 0.25-0.5-meter resolution (Figure 1). These targets can then be investigated with the use of a submersible or remotely operated vehicle (ROV)
This is how it’s done in a perfect world, but the problem is that the world is not perfect. Many modern research vessels, including NOAA Ship Okeanos Explorer, use hull-mounted multibeam sonar systems. Most, however, are not equipped with side scan sonar, particularly one rated for deep water. Leasing a deepwater capable side scan sonar system is usually cost prohibitive as it also requires hiring highly trained personnel to operate the system. Side scan sonar operations are also slow and tedious. So, the ideal way to identify targets to dive on is rarely realized and consequently many wrecks remain on the seafloor, undiscovered.
NOAA maintains the largest multibeam sonar repository in the world. These data are freely available to the general public. A small group of avid wreck hunters like us have decided to try and figure out ways to identify targets from these data alone, which are much lower resolution than those generated from side scan sonar.
It's not perfect and can't be used to find every type of wreck, but guess what? We are indeed finding wrecks! To date, we have found numerous ships, submarines, and even an aircraft.
First, it really helps to know something about the marine geology in the area of your search because you are trying to spot anomalies. By that, we mean shapes that are too linear to be rocks or an object observed in a location that’s difficult to explain geologically. For example, large rocks that break loose and slide downslope are usually found at the base of outcrops, not sitting on their flat top.

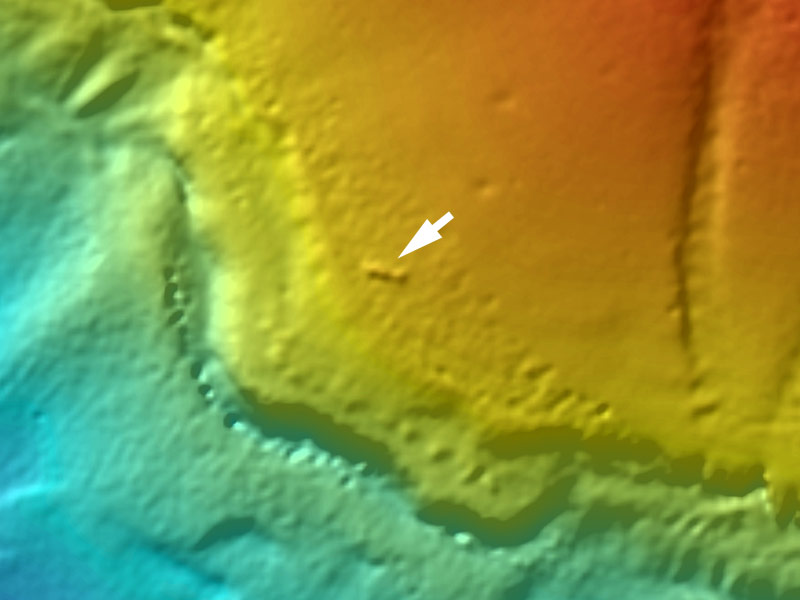
Figure 2: Multibeam sonar bathymetry image of the Japanese submarine, I-400. Image courtesy of Gary Fabian. Download larger version (jpg, 226 KB).
Figure 2 shows a linear anomaly that was sitting on the top of an outcrop, not the base. We decided its shape, size, and location all suggested it was a shipwreck, so a submersible dive was conducted on this target, and it was found to be the Japanese submarine I-400.
Secondly, rocks just sitting out in the middle of a large expanse of sediment seafloor are uncommon. You usually find rocks where there are other rocks or outcrops, not out in the middle of sediment flats. To look for hard objects out on sediment patches, you need to look at both the multibeam bathymetry as well as backscatter data. Bathymetry tells you how deep and how high an object sticks up from the seafloor. Backscatter is a measure of sonar intensity and can indicate how hard an object is. Some objects, like aircraft, don’t stick up very high from the seafloor, but they often have a high backscatter signature.
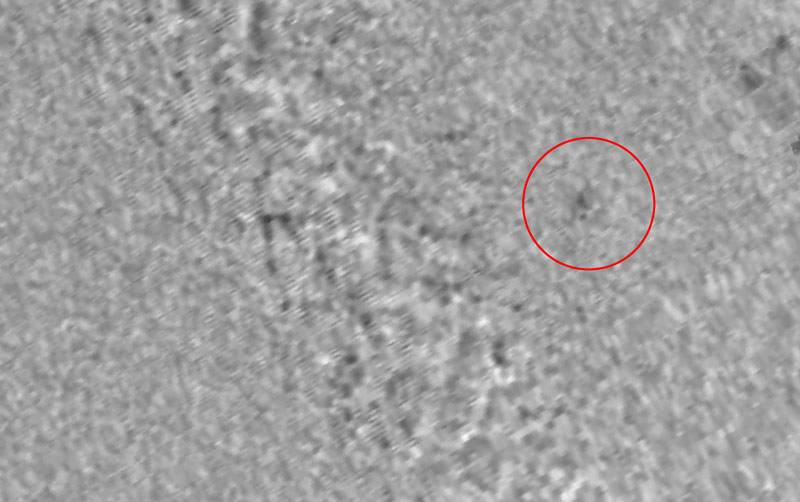
During the last day of the Okeanos Explorer 2016 Deepwater Exploration of the Marianas expedition, a dive was conducted on just such an anomaly. This anomaly turned out to be a Boeing B-29 Superfortress that crashed shortly after takeoff from Tinian Island during World War II. Figure 3 shows what the backscatter image looked like.
Note the difference in appearance of this aircraft versus the aircraft shown in Figure 1. Most aircraft wrecks look amorphous like the image of the B-29 because aircraft typically suffer considerable damage when striking the surface of the water. The F6F Hellcat shown in Figure 1 was one of the exceptions because the pilot was able to make a soft landing on the water and survived, with the plane gently sinking to the seafloor intact.

Figure 3: Multibeam backscatter image of a Boeing B-29 Superfortress off Tinian Island. Data collected by NOAA Ship Okeanos Explorer. Image courtesy of Christopher Kelley. Download larger version (jpg, 2 MB).
Finally, it really helps to have a good understanding of the software being used to acquire the data, as well as how to creatively use software for data analysis. In Figure 3, we were able to dismiss many of the dark patches to the left of the target as being nadir artifacts typical of multibeam backscatter data acquired with the Seafloor Imaging Systems (SIS) software. We have also learned how to visualize the raw unprocessed multibeam data files in Fledermaus and ArcGIS software, both of which greatly facilitate our ability to identify targets.
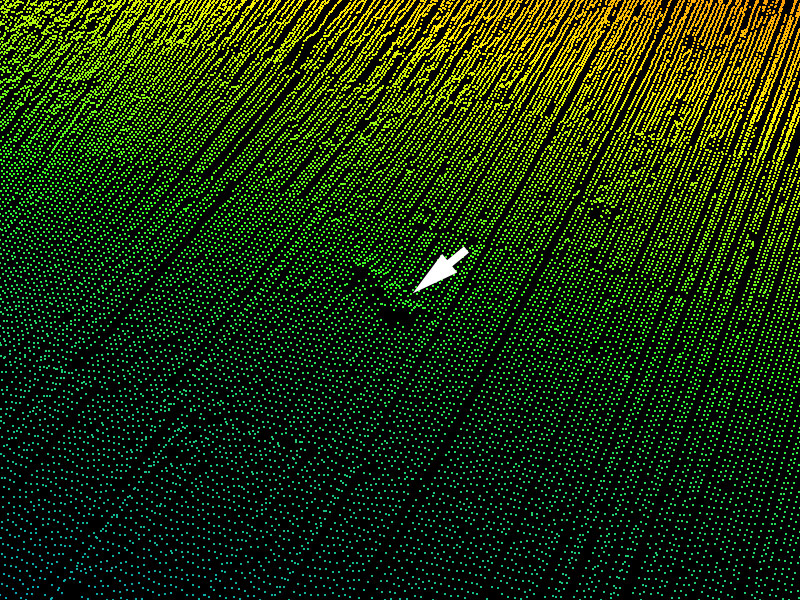
An example of what can be done to “tease out” as much information as possible from the data is shown in Figure 4. Instead of gridding the multibeam data into a smooth continuous surface, we examined the raw point data instead, which can reveal details that would be difficult if not impossible to see otherwise.

Raw multibeam point data of suspected wreck of Japanese destroyer Hayate. Image courtesy of Gary Fabian. Download larger version (jpg, 1.1 MB).
The target shown in Figure 4 appears to be too linear to be a natural rock formation. This target is in the area off Wake Island where the Japanese destroyer Hayate was reported sunk during the Battle of Wake in 1941. According to eyewitness accounts, the Hayate broke in half after being struck by a shell from a shore battery. The slight bend in the target is believed to represent the two parts of the destroyer settling close to each other or perhaps that the destroyer did not completely break in half.
However, we don’t know because we haven’t dove on this target yet. This dive is scheduled for the upcoming Okeanos Explorer Deepwater Wonders of Wake expedition. We will soon find out if another historic shipwreck has been discovered by analyzing multibeam data alone with methods that could be used to find many more wrecks in the near future.