From Aggregations to Individuals: Exploring Migrating Deep-Sea Scattering Layers Through Multiscale-Multimode Technologies in the Gulf of Mexico
Expedition Summary
By Kevin Boswell, Associate Professor and Director of the Marine Biology Program at Florida International University.
Overview
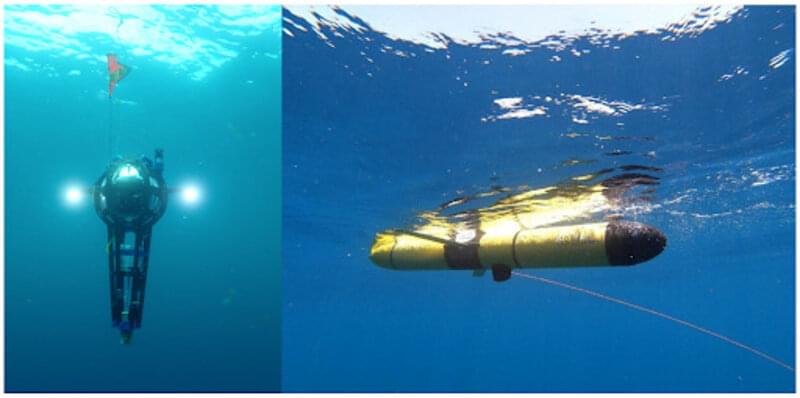
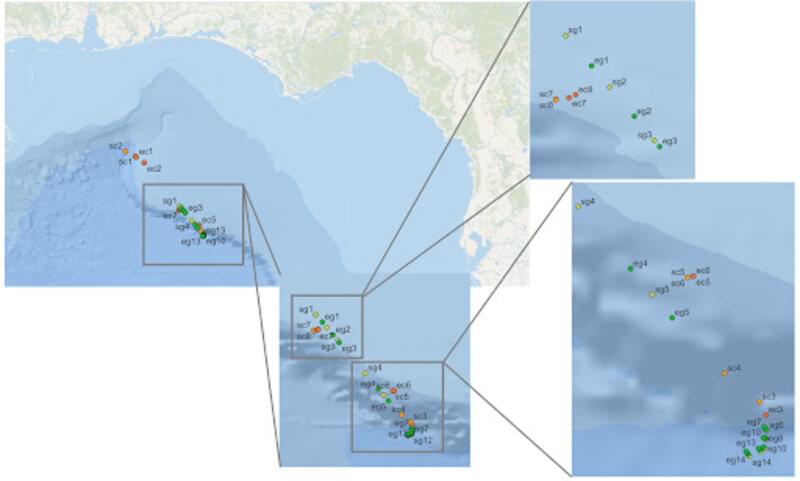
A one-week cruise aboard the R/V Point Sur was conducted to deploy two different autonomous sensor platforms (National Geographic Society Driftcam and Teledyne Webb Research Slocum Glider; Figure 1) developed as part of this project to explore the sound scattering layers of the Gulf of Mexico (Figure 2).
Figure 1. National Geographic Society Driftcam (left panel) and Teledyne Webb Research Slocum Glider (right panel) with echosounder housing protruding from the bottom of the glider. Image courtesy of Exploring Migrating Deep-Sea Scattering Layers. Download largest version (jpg, 185 KB).
The Driftcams were instrumented with a low-light camera to continuously image organisms that comprise the scattering layers, and to observe behavior, characterize the community structure, and estimate relative abundance without disturbing the organisms. With the use of a tracking beacon, the vertical position of the Driftcam could be changed from the ship to focus on a particular feature of the scattering layers, which were being tracked in real-time with the shipboard sonars.
The second platform, a Slocum Glider, was instrumented with a scientific sonar (Simrad EK80 Wide Band Transceiver “Mini” echosounder) and programmed to collect data as the glider descended through the water column. The echosounder provides high-resolution data on all objects that reflect sound at 200 kHz and can measure them out more than 50 meters (164 feet) from the glider, providing a novel look at the structure of scattering layers from a silent platform without the need for lights.
Figure 2. Map illustrating the deployments of both the Driftcams and Slocum Glider in the Gulf of Mexico from July 27-31, 2021. Labels “SC” and “SG” represent the start of Driftcam and Glider deployment, respectively. “EC” and “EG” represent the end of deployment for Driftcam and Glider, respectively. Image courtesy of Exploring Migrating Deep-Sea Scattering Layers. Download largest version (jpg, 47 KB).
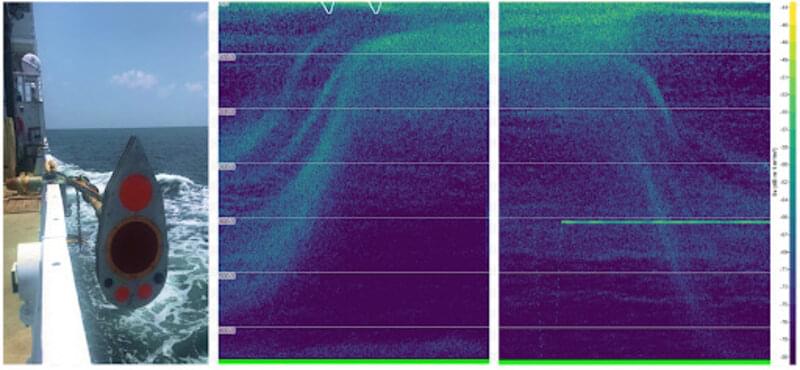
The ship was instrumented with a multifrequency echosounder system providing real-time observations of the depth and position of scattering layers in the water column (Figure 3). This information was used to inform the two platforms about where to target their sampling effort at depth. Given that these scattering layers are ubiquitous throughout this area of the Gulf of Mexico, the horizontal (latitude/longitude) position of the layers was not as important as the vertical position (depth in the water column), therefore we were able to maintain close association with the scattering layers by simply tracking their depth as seen on the ship’s echogram.
Figure 3. Multifrequency echosounder system aboard the R/V Point Sur with four frequencies (18, 38, 70, 120 kHz) installed (left panel). Ascending (center panel) and descending (right panel) phase of the diel vertical migration of the sound scattering layer observed from 0000 to about 1300 UTC on July 29, 2021. The scattering layer can be seen rising from 500 meters (1,640 feet) in depth to 100 meters (328 feet) in depth, and then back down again. The bright horizontal line at 400 meters (1,312 feet) in the right panel is the reflection from the CTD rosette that was also operating an autonomous echosounder at depth with two different frequencies (38 and 200 kHz). Image courtesy of Exploring Migrating Deep-Sea Scattering Layers. Download largest version (jpg, 83 KB).
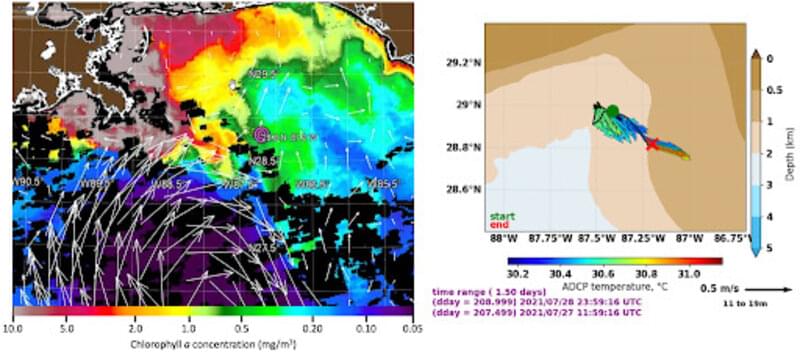
Figure 4. Left panel: Satellite surface Chlorophyll ɑ concentration overlaid with a web-based oceanographic model showing surface current vectors (larger arrows indicate stronger currents). Chlorophyll ɑ is a measure of the pigment concentration generated from phytoplankton, which indicates how much primary production is taking place in the water and is a sign of how nutrient rich the water is. High levels of Chlorophyll ɑ in offshore waters indicate a strong freshwater outflow from rivers into the ocean and strong southeast currents acting to move that freshwater offshore. The pink circle near 28.8N and 87.2W was the initial sampling location of the thick fresher surface layers. Right panel: Surface current vectors measured from the ship’s acoustic Doppler current profiler (ADCP) with surface water temperature (vector color) indicating the speed (vector size) and direction (vector angle) of water movement. Both the oceanographic model output (left) and ADCP surface currents confirm transport of Mississippi freshwater offshore and to the southeast. Image courtesy of Left panel: Image courtesy of USF College of Marine Science Optical Oceanography Lab ; Right panel: Image courtesy of Exploring Migrating Deep-Sea Scattering Layers. Download largest version (jpg, 78 KB).
Results
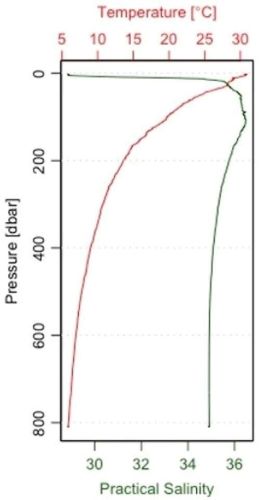
During this survey, we encountered a persistent and strong (~10 meter, or 32 foot) layer of freshwater on the surface due to a unique setup of high freshwater outflow from the Mississippi River and a very large Loop Current Eddy creating a rapid offshore flow of relatively fresh water over 60 miles from the mouth of the river (Figures 4 and 5). The low winds allowed for the low density and warmer freshwater to sit on top of the denser, saltier Gulf water, creating a strong density gradient. The Driftcams and the Glider rely on the ability to change their buoyancy to move through the water column and are finely tuned to operate optimally in well-mixed water. For example, if the glider was weighted to sink through the deeper saltwater, then it might not be able to produce enough buoyancy to rise up and through the less-dense freshwater. If the weight were to be removed to pass through the freshwater, then the glider may not be heavy enough to dive deep enough to observe deep scattering layers.
Figure 5. Water column profile of temperature and salinity at 29N, 87.6 W, where the water column exhibited a strong change in salinity in the upper 50 meters (164 feet) and matches the high-nutrient, productive waters (i.e., greater amounts of Chlorophyll ɑ) being pushed offshore from the Mississippi River. The green line represents practical salinity, the red line represents temperature, and the y-axis is a measure of depth. Image courtesy of Exploring Migrating Deep-Sea Scattering Layers. Download largest version (jpg, 35 KB).
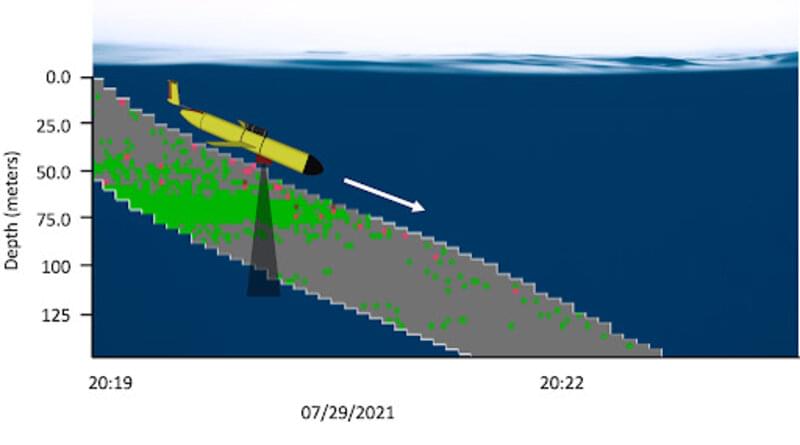
After repositioning the ship nearly 40 miles southeast of our original intended sampling area in order to reach better-mixed waters, the initial setup phase of the platforms was completed on board, and the two instruments were successfully deployed at depth and were able to target the sound scattering layers. The Driftcams were deployed eight times, two of which included two Driftcams being deployed simultaneously at different depths. The Slocum Glider was also deployed multiple times and completed a total of 14 dives into the scattering layers between 50 meters (164 feet) and almost 300 meters (984 feet). As the glider surfaced, a coarse echogram was generated along with a suite of metrics that characterize the scattering layers. These data, transmitted by satellite in near-real-time, offered scientists a direct look at what the glider encountered at depth and could be compared with the shipboard echosounder data. This is an important technological development that was derived from this project and will enhance the use of gliders for this purpose in the future (Figure 6).
Figure 6. A “pseudogram,” a coarse echogram generated by the glider, highlights the scattering layer that the glider encountered between 50-80 meters (164-262 feet) depth. Green corresponds to stronger sound scattering, grey areas indicate the part of the water column where the glider did not detect any scattering during its descent. When the glider surfaces, it transmits this “pseudogram” via satellite to researchers to help determine where the scattering layers are. At the end of a mission the glider is retrieved and the high-resolution raw data can be downloaded. Image courtesy of Exploring Migrating Deep-Sea Scattering Layers. Download largest version (jpg, 33 KB).
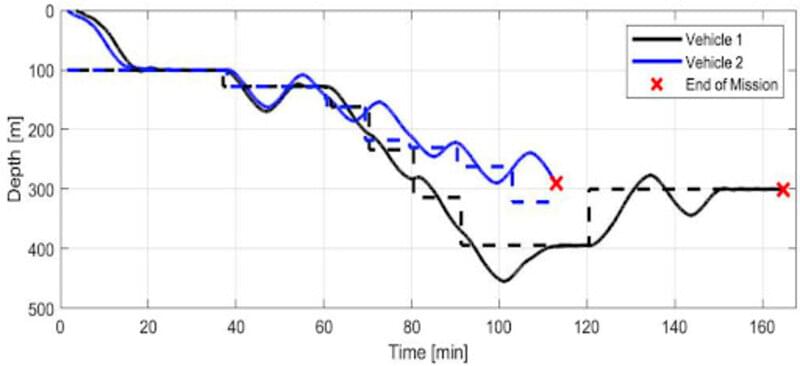
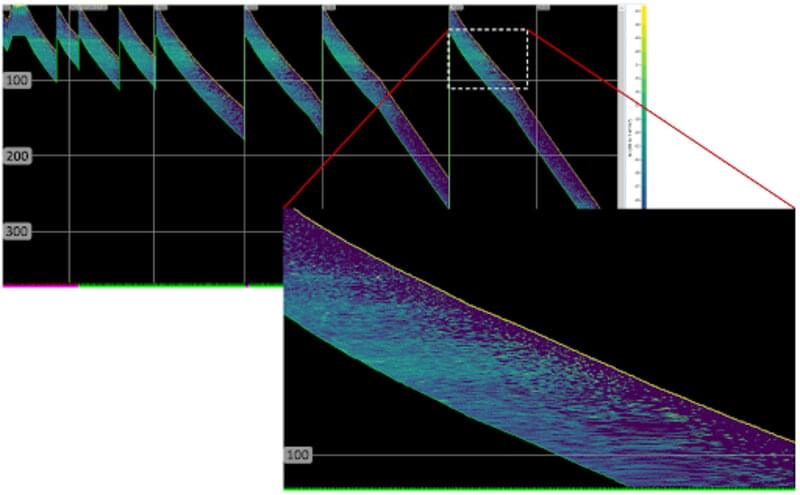
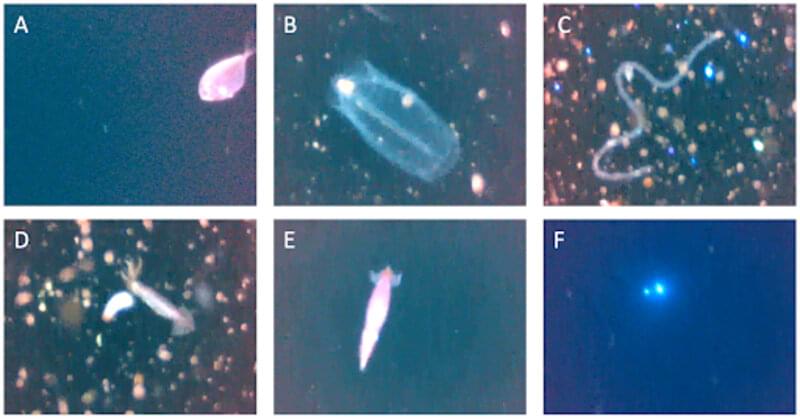
Both autonomous sensor platforms were instrumented to measure attributes of the scattering layers at different resolutions and scales. While the deeper phases of the layers (600-1,000 meters or 1,969-3,281 feet) were not examined as we had planned, the combined data from both platforms indicated that we could acquire novel information on the characteristics of scattering layers and has a high likelihood of improving future studies in these remote regions of the ocean (Figures 7-9).
Figure 7. Dive profile of a simultaneous deployment with two Driftcams. “End of mission” indicates the time when each vehicle was instructed to transit to the surface. Image courtesy of Exploring Migrating Deep-Sea Scattering Layers. Download largest version (jpg, 34 KB).
Figure 8. Echogram from the Glider’s Simrad EK80 Wide Band Transceiver “Mini” echosounder from 1700 to 2200 UTC on July 29, 2021 (upper panel). There is a prominent scattering layer at 50 meters (164 feet), and a faint layer at 250 meters (820 feet). The white, dashed box indicates a zoomed in view (lower panel) of the echogram at 2200 UTC on July 29. As the glider approaches the scattering layers, the layer appearance changes from a fuzzy cloud with a mix of organisms (left side of the lower right panel) to individual organisms and scatters discernable as dots and traces, which allow for closer examination of individual acoustic target strengths (right side of lower right panel). For all dives, the echosounder was configured to collect data to a 50 meter (164 foot) range. Image courtesy of Exploring Migrating Deep-Sea Scattering Layers. Download largest version (jpg, 86 KB).
Figure 9. Organisms detected with the Driftcam within a sound scattering layer between 70-100 meters (230-328 feet). (A) pomfret, Brama caribbea; (B) solitary salp, Salpa spp.; (C) alcypoid polychaete worm, Vanadis spp.; (D and E) ; squid, family Ommastrephidae (F) lights from second Driftcam. Image courtesy of Exploring Migrating Deep-Sea Scattering Layers. Download largest version (jpg, 237 KB).
Next Steps and Other Opportunities
In future deployments we would like to evaluate changes in lighting schemes for the Driftcam (different wavelengths, strobes vs. periodic) and utilize varied foci or auto-focusing to determine the best way to non-invasively characterize the community relative to the effects of the light field. Similarly, with the glider, we aim to have more consistent dives to greater depths (~800 meters or 2,625 feet) to determine if there is measurable backscatter in the deep pelagic realms of the Gulf of Mexico.
We plan to leverage the outcomes of this project to seek opportunities for additional time at sea and focus on deeper simultaneous dives associated with the ongoing DEEPEND-RESTORE program . Additionally, there is ongoing work to expand the feasibility of using multiple autonomous platforms as a swarm, providing significantly more data within an area through a network of several platforms.
Video segments illustrating the targeted organisms identified in Figure 9 above, in the sound scattering layer between 70-100 meters (230-328 feet). In the segments from which Figures 9B-9D were pulled, the small moving particles are likely amphipods that are outside of the focal range of the camera. Video courtesy of Exploring Migrating Deep-Sea Scattering Layers. Download largest version (mp4, 115.7 MB).

