Adrienne Copeland, NOAA Ocean Exploration
Published May 7, 2021
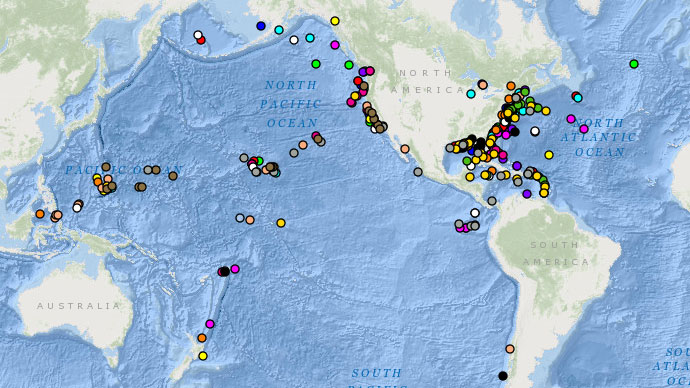
The water column, a vertical expanse of water extending from the surface to the seafloor, is the largest and least explored biome on the planet (Webb et al., 2010), making it vital to investigate. One of the tools we use to explore the water column is a split-beam echosounder.
To survey the water column, split-beam echosounders use a transducer (Figure 1) mounted to the hull (bottom) of a ship to send out a continuous wave (CW) ping at a specific frequency and “listen” for the echoes to return from objects the sound encounters. Anything in the water column with a density and/or sound speed difference from the surrounding water will scatter sound, and this backscatter of sound can tell us information about what is in the water column. See the Understanding Our Ocean with Water-Column Sonar Data storymap to learn more about what these data can tell you.

Figure 1: Image of an ES120-7c transducer, one of the models mounted on the hull of NOAA Ship Okeanos Explorer. This transducer emits a sound centered around 120 kilohertz into the water column and receives echoes back from anything with a density and/or sound speed difference from the surrounding water. Image courtesy of Simrad. Download image (jpg, 231 KB).
NOAA Ship Okeanos Explorer is equipped with five hull-mounted transducers which each ping at a specific frequency: 18, 38, 70, 120, and 200 kilohertz (Figure 2). Each submerged transducer is connected via a long cable to a unit on the ship that controls the settings of these transducers. These topside units are called transceivers, and depending on the system, they can have different names. The ship was originally outfitted with general purpose transceivers (GPTs) and the entire system (transducer plus GPT) is referred to by the manufacturer's name: EK60s. However, in recent years, the components of the EK60 GPTs are no longer commercially available and the data acquisition software (ER60) is no longer developed. So, this system was replaced with the EK80.
 of NOAA Ship Okeanos Explorer. The transducers are located on the hull of the ship in a fairing, which is an external structure added to the hull to reduce drag and help ensure the collection of good quality data.")
Figure 2: Illustration of the bottom (hull) of NOAA Ship Okeanos Explorer. The transducers are located on the hull of the ship in a fairing, which is an external structure added to the hull to reduce drag and help ensure the collection of good quality data. Image courtesy of Charlie Wilkins. Download image (jpg, 1 MB).
In 2017 and 2021, two of the ship’s echosounders were upgraded from EK60s to EK80s - the 38 and 70 kilohertz systems. During this upgrade, the GPTs were replaced with wide band receivers (WBTs) (Figure 3). Unlike the EK60s, which could only send out a CW at a very narrow frequency range, the EK80s can send out a pulse over a broad range of frequencies in a frequency modulated (FM) mode, as well as in CW mode. By providing information over a wider range of frequencies, we can get more information about what is in the water column by looking at the characteristics of the frequency response of objects over this wider range.
Everything with a sound speed and/or density difference will scatter sound, but depending on the properties of the object, it will scatter sound differently at different frequencies, and the strength of this scattering (target strength) can also vary. By increasing the frequency range, we can begin to separate objects from each other based on the patterns of their responses. This feature also offers the potential for greatly improved range resolution (can sample deeper waters) and increases in the signal strength over the background noise (signal-to-noise ratio).
 (bottom, grey box) and the wide band transceiver (WBT) (top, black box) on NOAA Ship Okeanos Explorer. This WBT controls the 38 kilohertz frequency and was upgraded from a GPT in 2021.")
Figure 3: Image of the general purpose transceiver (GPT) (bottom, grey box) and the wide band transceiver (WBT) (top, black box) on NOAA Ship Okeanos Explorer. This WBT controls the 38 kilohertz frequency and was upgraded from a GPT in 2021. Image courtesy of NOAA Ocean Exploration, 2021 EM 304 Sea Acceptance Testing and Mapping Shakedown. Download image (jpg, 1.6 MB).
While there appears to be some added benefits of these systems, there may also be some drawbacks. For over 10 years, the EK60s have been the standard tool for collecting information about organisms in the water column, to conduct stock assessments of fish and to learn more about animals that inhabit the deep sea. Ensuring that the data the EK80 systems collect is comparable to their predecessor is an actively ongoing area of research (e.g. de Robertis et al., 2019).
Additionally, the EK80s can collect one to two orders of magnitude more data than EK60, depending on the bandwidth and other configurations (Demer et al., 2017). This can be a problem when there is limited data storage or archival capacity or when trying to transmit data to shore from the sea. Additional complications may arise when analyzing and interpreting these data and ensuring that they are calibrated. Learn more about split-beam calibrations here.
While these potential drawbacks should be kept in mind when using the new system, the new capabilities could potentially improve our understanding of the water column and its inhabitants moving forward (Figure 4).

Figure 4: Artist rendition of the water column which is divided into five zones from the surface to the seafloor. Each zone varies in pressure, light, temperature, oxygen, nutrients, and biological diversity. Image courtesy of Barbara Ambrose, NOAA. Download image (jpg, 406 KB).
De Robertis, A., Bassett, C., Andersen, L. N., Wangen, I., Furnish, S., and M. Levine, 2019. Amplifier linearity accounts for discrepancies in echo-integration measurements from two widely used echosounders, ICES Journal of Marine Science, Volume 76, Issue 6, Pages 1882–1892. https://doi.org/10.1093/icesjms/fsz040
Demer, D., Andersen, L., Bassett, C., Berger, L., Chu, D., Condiotty, J., Jr, G., Hutton, B., Korneliussen, R., Bouffant, N., Macaulay, G., Michaels, W., Murfin, D., Pobitzer, A., Renfree, J., Sessions, T., Stierhoff, K., and C. Thompson. (2017). Evaluation of a wideband echosounder for fisheries and marine ecosystem science. https://doi.org/10.17895/ices.pub.2318
Webb, T. J., Berghe, E. V., and Odor, R. (2010). Biodiversity’s Big Wet Secret: The Global Distribution of Marine Biological Records Reveals Chronic Under-Exploration of the Deep Pelagic Ocean. PLoS ONE,5 (8). https://doi.org/10.1371/journal.pone.0010223