By Adrienne Copeland, NOAA Office of Ocean Exploration and Research
April 3, 2018
Have you ever tried to find a needle in a haystack? I haven’t, but can imagine it is similar to trying to calibrate the Simrad EK60 split-beam echosounder using a calibration sphere. NOAA Ship Okeanos Explorer has five EK60 transducers of varying frequencies (18, 38, 70, 120, and 200 kHz) mounted on the hull of the ship in the scientific transducer fairing.

A drawing of NOAA Ship Okeanos Explorer with the scientific transducer fairing highlighted in red. Image courtesy of the Gulf of Mexico Technology Demonstration. . Download larger version (jpg, 195 KB).

The locations of the scientific sonars throughout the transducer fairing. Based on expected data collection in the Gulf of Mexico, the calibration team calibrated the Simrad EK60 frequencies of 18, 38, 70, 120, and 200 kHz. Image courtesy of the Gulf of Mexico Technology Demonstration. . Download larger version (jpg, 697 KB).
These echosounders are scientific fish finders that the ship uses to document what is in the water column. They send out a ping at a very specific frequency and receive the echoes back from objects in the water column (e.g., fish, seafloor, bubbles, etc.).
Without calibration, we would only be able to know that something is there and not be able to accurately quantify the characteristics of this object. A calibration is needed in each of the water masses that NOAA Ship Okeanos Explorer visits because the water properties can greatly influence the sonar signal. The changing temperature and salinity of the water can change the speed of the emitted acoustic signal, thus changing the echo returns of the object. You can learn more about the data these systems collect by visiting the mission logs from this expedition.
 and 38.1-millimeter tungsten carbide sphere (right) used during NOAA Ship Okeanos Explorer Simrad EK60 split-beam transducer calibration.")
The 64-millimeter copper sphere (left) and 38.1-millimeter tungsten carbide sphere (right) used during NOAA Ship Okeanos Explorer Simrad EK60 split-beam transducer calibration. Image courtesy of the Gulf of Mexico Technology Demonstration. . Download larger version (jpg, 2.7 MB).
For the calibration, our “needle” is a very specific sphere. It is either a 38.1-millimeter tungsten carbide sphere, about the size of a golf ball, for four of the frequencies, or a 64-millimeter copper sphere, a little smaller than a baseball, for the 18 kHz frequency.
Each of these spheres is suspended about 15 - 20 meters (49 - 66 feet) below the hull of our 224-foot ship using three fishing pole downriggers to triangulate their positon in the beam of the sonars. While the small size of these spheres makes them hard to find, the size and composition is very important for the calibration process because their properties are constant at known frequency ranges, resulting in very predictable echo returns that we can measure. To calibrate the system, we measure the deviation of these echo returns from the factory settings and update each transducer accordingly.

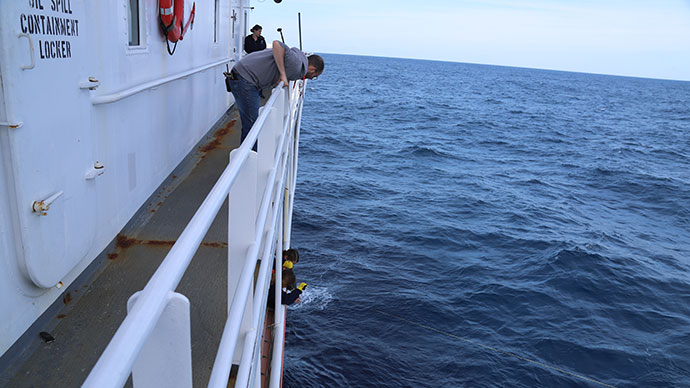
Example of the downrigger setup on the port side of NOAA Ship Okeanos Explorer. Image courtesy of the Gulf of Mexico Technology Demonstration. . Download larger version (jpg, 292 KB).
Each transducer has a seven-degree beam width (except the 18 kHz, which has a 12-degree beam width) and finding the sphere in each transducer can be tricky to do if you do not have an accurate measurement of how much line is out of each downrigger reel. To get line-out measurements, we use a specific type of spectra line (which is acoustically transparent and does not interfere with our signal), which changes color every 25 feet, leading to very accurate placements of the sphere each time.
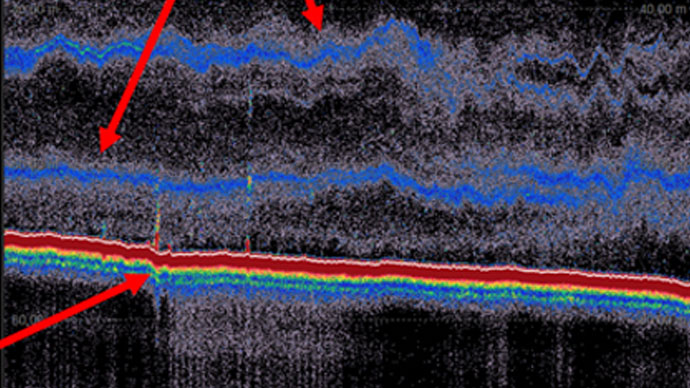
Once the sphere is tracked down, we have to move this sphere throughout the beam to get adequate coverage throughout the entire beam footprint. Once you have adequate coverage, you can use the collected values to update the transducer values and check that your error is not high; the sonar manufacturer recommends root mean square (RMS) error values no higher than 0.4. This procedure is repeated for every frequency and pulse duration (length of transmission) for which we expect to collect data.

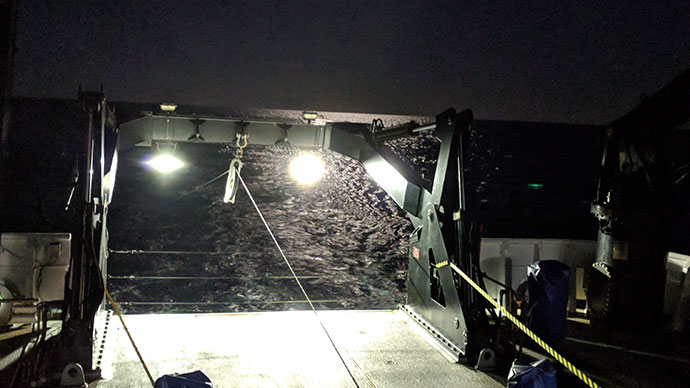
Image of the calibration team attaching the calibration sphere to the three spectra lines on the starboard side of NOAA Ship Okeanos Explorer. The yellow spectra line from the starboard aft downrigger can be seen in the right portion of the image. Image courtesy of the Gulf of Mexico Technology Demonstration. . Download larger version (jpg, 9.2 MB).
Once done, we can finally celebrate because we found the needle in the haystack (12 times for various frequency and pulse duration combinations) and we can prepare to do this all again next year for our work in the Atlantic Ocean.