An official website of the United States government
Here’s how you know
Official websites use .gov A
.gov website belongs to an official government
organization in the United States.
Secure .gov websites use HTTPS A
lock (
) or https:// means you’ve safely connected to
the .gov website. Share sensitive information only on official,
secure websites.
LIVE VIDEO: The 2026 Cook Islands ROV Exploration is underway. Watch live dives to explore deep-sea habitats of the Cook Islands.
Seafloor Mapping
Seafloor Mapping
Our global ocean covers over 70% of the Earth’s surface. The marine ecosystem is the largest and most abundant in the world. However, most of the ocean is permanently dark, cold, and incredibly difficult to observe. Only slightly more than 23% of the seafloor has been mapped in great detail, and even less has been explored with underwater cameras or submersibles. Mapping the seafloor is the first step in exploring the unknown depths of our global ocean.
Maps are a visual representation of objects in space. Maps help us navigate and make sense of the world. They also give order to complex environments by revealing spatial relationships and patterns. The location of anything is mappable using three axes: latitude (x), longitude (y), and elevation or depth (z).
Land elevation represents land height above sea level.
Seafloor bathymetry represents land depth below sea level.
Topographic maps show the physical shape of dry land using elevation values.
Bathymetric maps show the physical shape of the seafloor using depth values.
Together, topographic and bathymetric maps show the physical features on the Earth’s surface. Having a base map of our planet’s physical features makes it easier for us to map other things like streets, coral reefs, or your favorite park!
History of Mapmaking
The world’s most ancient maps date back thousands of years. Geographic information was once painted on cave walls and chiseled into clay tablets. Many civilizations around the world used maps to tell stories. Ancient maps marked trade routes, hunting grounds, socioeconomic trends, natural features, and more. For most of human history, maps were hand-drawn and considered quite artistic. Cartography is the art and science of mapmaking. People who make maps are cartographers.
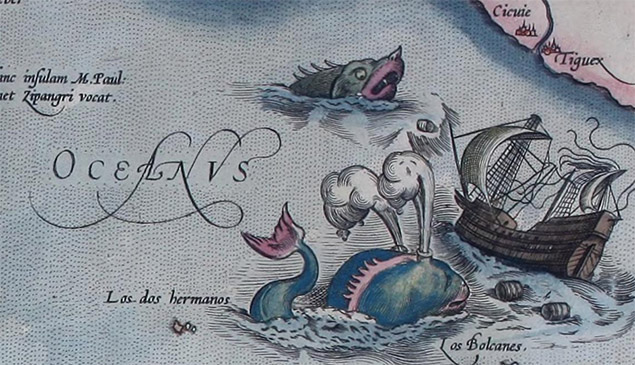
For most of history, what lay below the sea surface and on the seafloor was a mystery. Yet cartographers still searched for ways to include information about the ocean in their maps. Early mariners made maps and calculated their position by visually observing the Sun, stars, and landmarks. However, observing the seafloor proved more difficult. Cartographers resorted to labeling unexplored territories with “Here be dragons.” Often, cartographers drew sea monsters to signify unknown but potentially dangerous seas.
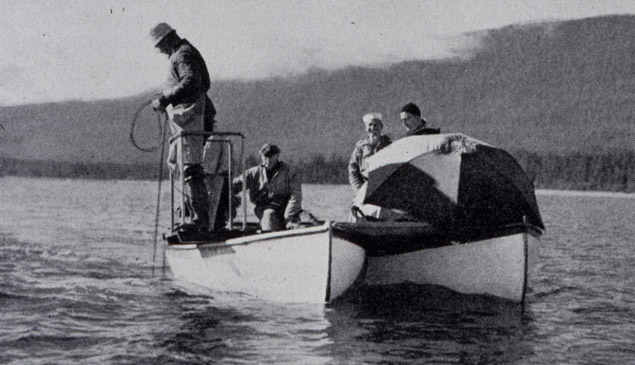
Mariners in the early 1800s started using weighted ropes, called lead lines, to measure seafloor depth around harbors. This method was time-consuming and proved more difficult in deeper waters. Considering that the average seafloor depth is about 3.5 kilometers (2.2 miles), it’s no wonder the seafloor remained a mystery for so long.
Sonar technology was developed in the 1920s and significantly improved seafloor mapping. Sonar systems emit a sound and then record the time it takes to receive an echo off the seafloor. Seafloor depth is calculated using the time difference from when the sounds are made to when the echoes are heard.
Early single-beam sonar systems, called fathometers, were used to measure the seafloor depth beneath a ship. In the 1960s, multibeam sonar systems were developed to measure a larger area using many beams of sound in a fan-shaped pattern. Multibeam sonar can map much broader areas than single-beam sonar.
This mid-16th century atlas contained many maps full of sea monsters and ships in distress. Image courtesy of The British Library.
Surveyors measure seafloor depth with a handheld lead line (1942). Image courtesy of 1942 Hydrographic Manual.
SONAR EXPLAINED
Sonar stands for Sound Navigation and Ranging. There are two main types of sonar: active sonar and passive sonar. Active sonar systems emit a pulse of sound into the water, which then bounces off the seafloor, creating an “echo.” Seafloor depth is calculable using the time difference between creating a sound and receiving its echo.Passive sonar systems are quiet. They detect environmental noise made by ships, submarines, and marine life.
Today it’s easy to feel as though we know everything about the shape of the world around us. Our phones can guide us to our destination, and Google Earth shows us our world in incredible detail. All digital maps, including those on our phones, are made possible by geographic information systems (GIS). Digital maps are more accurate, easier to manage, and can accommodate more information. As GIS allows people to analyze patterns and relationships in spatial data, many modern professions use this technology in city planning, business decisions, disaster response, ocean science, and more.
Tools for Understanding the Seafloor Today
Contemporary seafloor mapping is often conducted using multibeam sonar systems on ships and other marine vessels. Multibeam systems produce high-resolution data, meaning that there are many data points per area. More data points means you can see more details. Multibeam bathymetric maps are suitable for many applications including safe navigation and studying benthic habitats. Benthic habitats are those closest to the seafloor, or the benthos. Unfortunately, it is remarkably difficult and expensive to send vessels to map the most remote parts of the ocean. Due to cost and logistics, slightly more than 23% of the seafloor has been mapped in high resolution as of 2022.
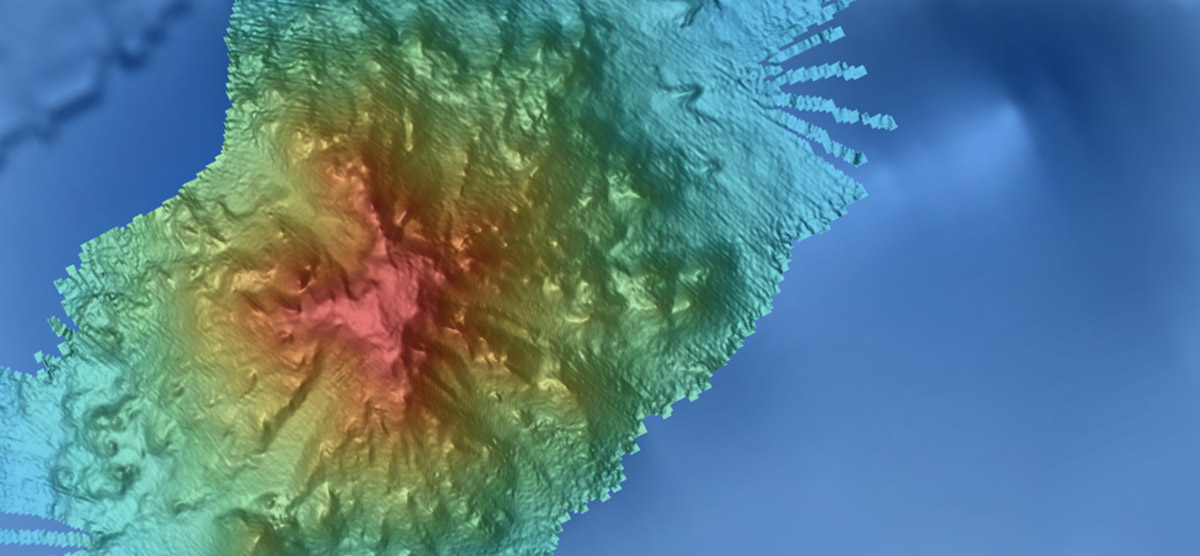
While researchers would rather have high-resolution data in all regions, modern bathymetric maps use a combination of high- and low-resolution data. Although low-resolution data are not the best, they are still better than nothing. Low-resolution data can still help us understand ocean environments. Much of this low-resolution data comes from satellite altimeters. Large underwater features, like seamounts larger than 1.5 kilometers (0.9 miles), have enough mass to affect the gravitational force in a given area. This change in gravity creates tiny bumps and dips on the sea surface. Satellite altimeters are sensitive enough to detect and measure these changes.
Scientists then use these measurements to estimate the general shape of the seafloor. This low-resolution map is what you see on Google’s terrain, or satellite, view of Earth. It allows us to see the global seafloor, but if you look closer, you will find that many of the details are blurry.
High-resolution data contain more data points and give more insight into how the seafloor is shaped. Slide the arrow back and forth to compare satellite-derived bathymetry data to high-resolution bathymetry data. Images courtesy of National Centers for Environmental Information.
What Have We Learned About the Seafloor So Far?
Thanks to sonar mapping systems and satellite altimetry, we are now starting to understand the complexity of the seafloor. Much like the dry land we live on, the seafloor contains physical features like mountains, valleys, and plains. At approximately 65,000 km to 65,000 kilometers (40,390 miles), the mid-ocean ridge is technically the longest mountain range on Earth. The deepest point in the ocean drops an incredible 11,000 meters (6.8 miles) beneath the sea surface—that is deeper than Mount Everest is tall! These remarkable features, and others still awaiting discovery, play a critical role in life on Earth. Bathymetric maps are fundamental to understanding our ocean’s history, marine archaeology, ocean currents, and benthic habitats such as deep-sea coral reefs.
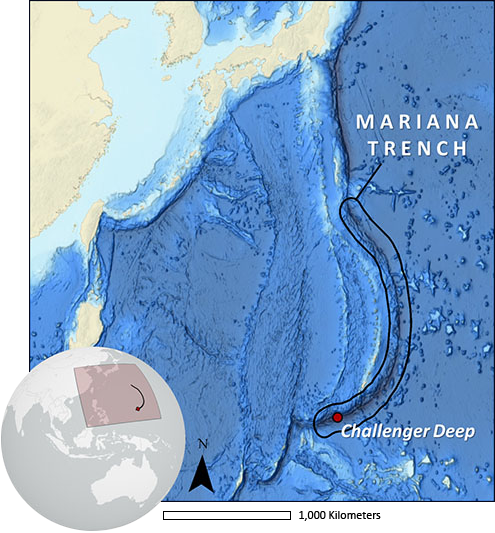
Map showing location of Challenger Deep in the Mariana Trench. Map courtesy of NOAA National Centers for Environmental Information.
The Mariana Trench is the deepest trench in the world, located in the western Pacific Ocean near Guam and the Mariana Islands. The deepest part of the trench is named Challenger Deep after the British ship HMS Challenger, whose crew first sounded, or measured seafloor depth, in 1875. Scientists recently reevaluated its depths using multibeam data and updated the deepest known point to approximately 10,935 meters (6.8 miles).
Example of a baleen whale call recorded at Challenger Deep. The call mostly closes resembles a Bryde’s whale call.
The sound of a magnitude 5 earthquake that occurred near Challenger Deep 16 July 2015.
Our understanding of the seafloor has come a long way from the early days of lead lines and tales of sea monsters. However, global efforts to map the seafloor are far from complete. In 2005, the USS San Francisco, a nuclear submarine, collided with an uncharted seamount. The current nautical charts in the area were not detailed enough for navigators to see the underwater mountain. Despite damage to the submarine, it was able to surface. This incident highlighted the need for high-resolution multibeam bathymetry data across the entire ocean.
Mapping the seafloor can reveal features, such as seamounts, that we didn't even know existed before. Mapping is a key foundational step in all ocean exploration operations. Video courtesy of NOAA Ocean Exploration, 2016 Hohonu Moana.Download largest version (mp4, 327.7 MB).
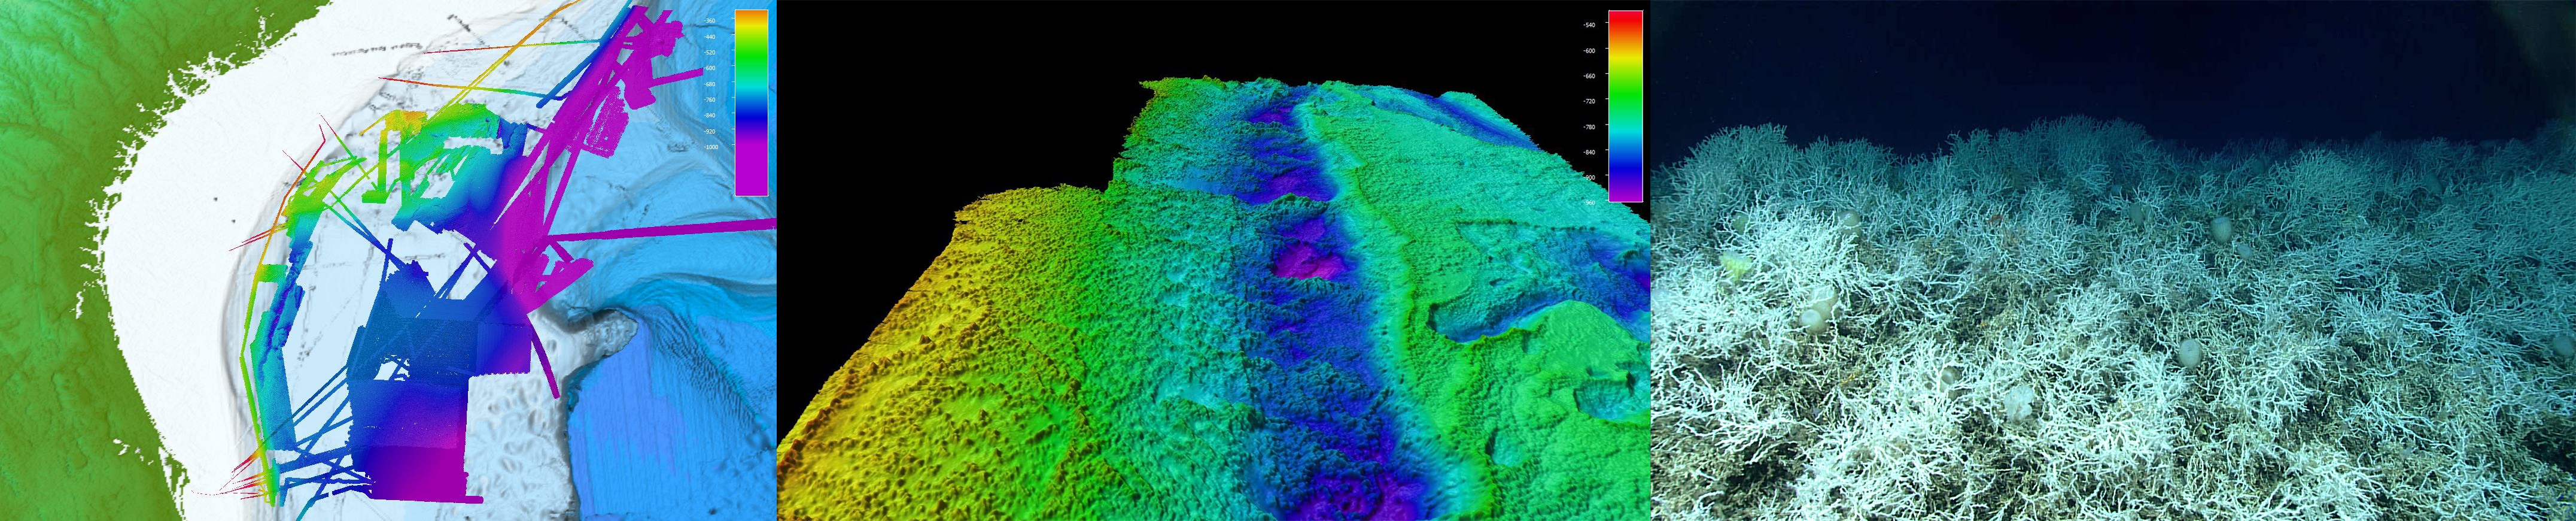
NOAA Ocean Exploration has been mapping the seafloor of the Blake Plateau off the Southeast United States aboard NOAA Ship Okeanos Explorer (left) since 2011. As a result of this mapping, NOAA Ocean Exploration and partner scientists discovered mounds of extensive, dense populations of the deep-sea, reef-building coral Lophelia pertusa (middle and right) — some in areas previously believed to be flat and featureless. These mounds have been growing for thousands, perhaps millions, of years and provide shelter and habitat to a variety of marine life. Now, at 28,047 square kilometers (10,829 square miles), this area is considered to be the largest known deep-sea coral province in U.S. waters, possibly the world. Additional mapping data collected with the support of NOAA Ocean Exploration (not shown here) have contributed to a near complete map of the deep waters of the Blake Plateau, an area of interest for the National Strategy for Mapping, Exploring, and Characterizing the United States exclusive economic zone. Images courtesy of NOAA Ocean Exploration.
What’s Next for Seafloor Mapping?
In the United States, there is an entire organization, NOAA Ocean Exploration, dedicated to exploring the deep ocean and filling the gaps in our understanding of the world’s deep waters and the seafloor. Using NOAA Ship Okeanos Explorer, NOAA Ocean Exploration has mapped over 2 million square kilometers (772,204 square miles) of seafloor. However, mapping the seafloor with multibeam sonar is time-consuming. A ship must move slowly and systematically to ensure there are no gaps. It has been calculated that it would take one ship nearly 1,000 years to map the entire ocean at all water depths.
Scientists and governments around the world recognize the importance of making a high-resolution global map of the seafloor. An international collaboration called the Nippon Foundation-GEBCO Seabed 2030 Project aims to produce a high-resolution global map of the seafloor by 2030. Another global initiative, led by the International Hydrographic Organization, aims to increase the use of crowdsourced bathymetry, enabling mariners to share depth measurements collected with standard navigation instruments during normal operations. Cruise ships, fishing boats, and even yachts are contributing to a better global bathymetric map. In the United States, there is an effort to fully map the exclusive economic zone, or area of water around the coastline. A country’s exclusive economic zone is where that country has jurisdiction over both living and nonliving resources.
Mapping the entire seafloor by 2030 is an ambitious goal. This global effort is too big a task for one ship or one nation to tackle alone, so governments are collaborating to map the seafloor as efficiently as possible. Technology is being pushed to new limits. Organizations are inventing new vessels and leveraging the use of autonomous vehicles. Geographic information systems (GIS) are allowing people to visualize the seafloor like never before.
Despite its importance, the majority of our ocean is largely unknown. Through exploration, we’re learning more about its biological, chemical, physical, geological, and archaeological aspects every day. But before we can truly explore, we must map. Video courtesy of NOAA Ocean Exploration.Download largest version (mp4, 270 MB).
A new global bathymetric map will benefit us all. Using GIS, we will be able to accurately view entirety of the Earth’s surface for the first time in history. Having this data layer will improve global prediction models related to weather and climate, tsunami impact zones, and sea-level rise. Countries will be able to prioritize conservation efforts to improve fish stocks and coral reefs. Seeing the seafloor with such clarity will reveal more information than we can imagine. Many underwater discoveries have been made just in the last year alone: the well-preserved 1915 shipwreck Endurance was recently found in the icy Antarctic waters, and a new healthy coral reef was just uncovered near Tahiti. Who knows what future discoveries are yet to come?
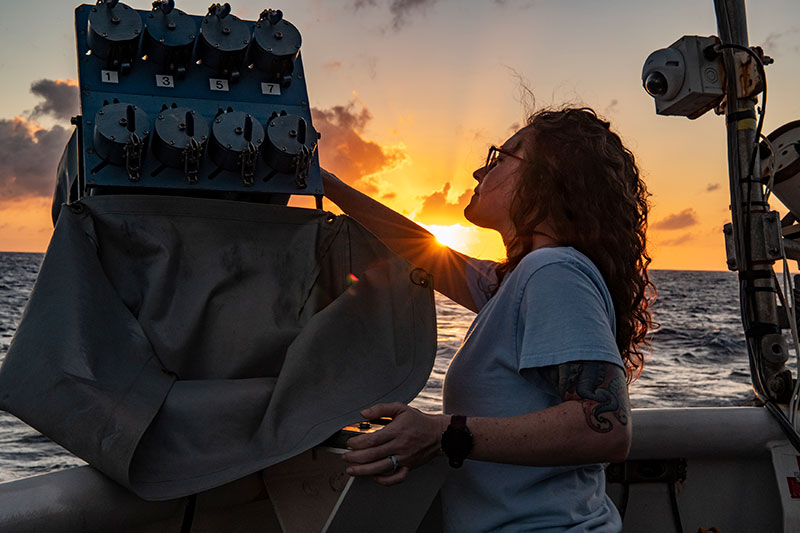
Danielle Warren with the Expendable Bathythermograph (or “XBT” for short) launcher during the 2022 Caribbean Mapping Expedition. The XBT is a probe used to measure temperature throughout the water column, generating a temperature profile. Image courtesy of Caitlin Bailey, GFOE, 2022 Caribbean Mapping.
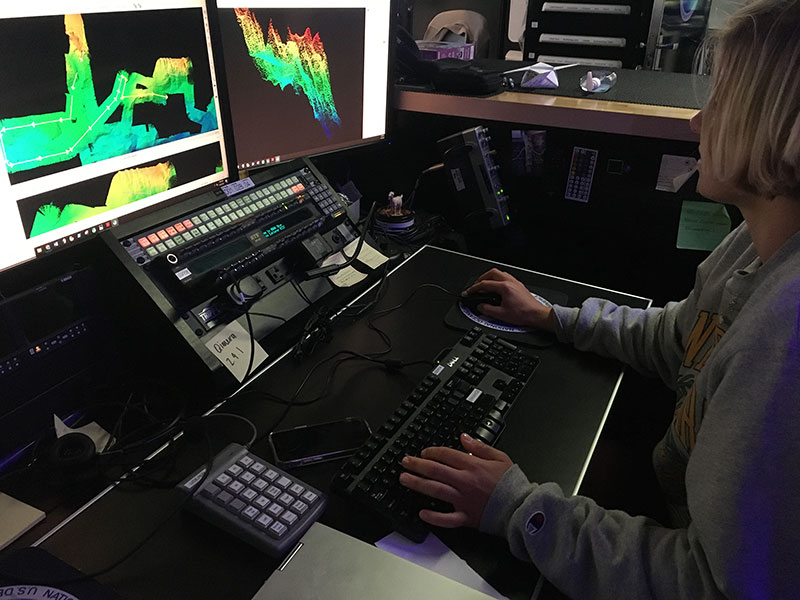
Explorer-in-Training Paige Hoel helps to fill seafloor mapping gaps off Puerto Rico, in U.S. waters off the U.S. East Coast, and in the high seas. Among her tasks is "cleaning" multibeam sonar data to make sure they are correct, consistent, and usable. Image courtesy of NOAA Ocean Exploration, 2022 Puerto Rico Mapping and Deep-Sea Camera Demonstration.
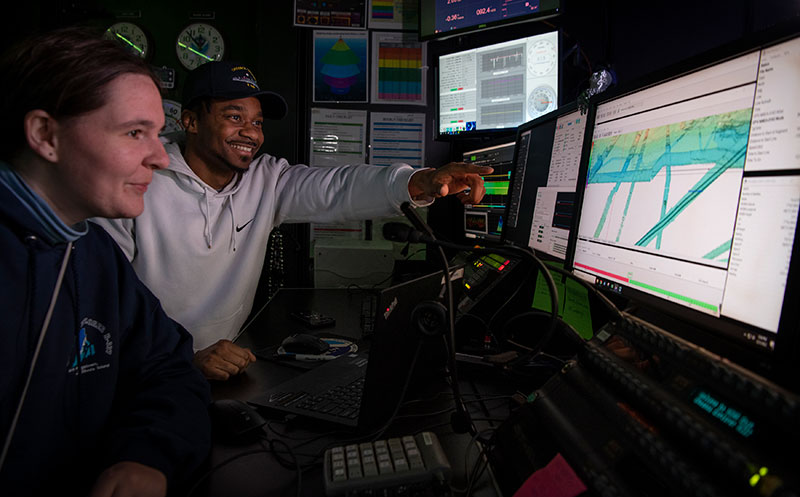
Explorers-in-Training Daryin Medley and Kathrin Bayer in the control room of NOAA Ship Okeanos Explorer viewing multibeam bathymetry data collected during the 2022 Caribbean Mapping expedition. Image courtesy of Caitlin Bailey, GFOE, 2022 Caribbean Mapping.
Mapping Careers
Today, many professions need geographers, cartographers, engineers, and data scientists. GIS is necessary in many aspects of our society, including public works projects, business decisions, disaster response, epidemiology, and so much more. Additionally, many industries require seafloor mapping experts for the implementation and evaluation of offshore wind farms, petroleum platforms, and submarine communication cables. NOAA Ocean Exploration hosts an Explorer-in-Training program that allows students and early career scientists to learn seafloor mapping and other aspects of ocean exploration. Learn more about the Explorer-in-Training program.
NOAA NCEI, the National Centers for Environmental Information, partners with NOAA Ocean Exploration to manage, archive, and disseminate data collected on its expeditions. NCEI maintains one of the most significant data archives on Earth, providing the public with comprehensive oceanic, atmospheric, and geophysical data.