

Geographic Information System (GIS)
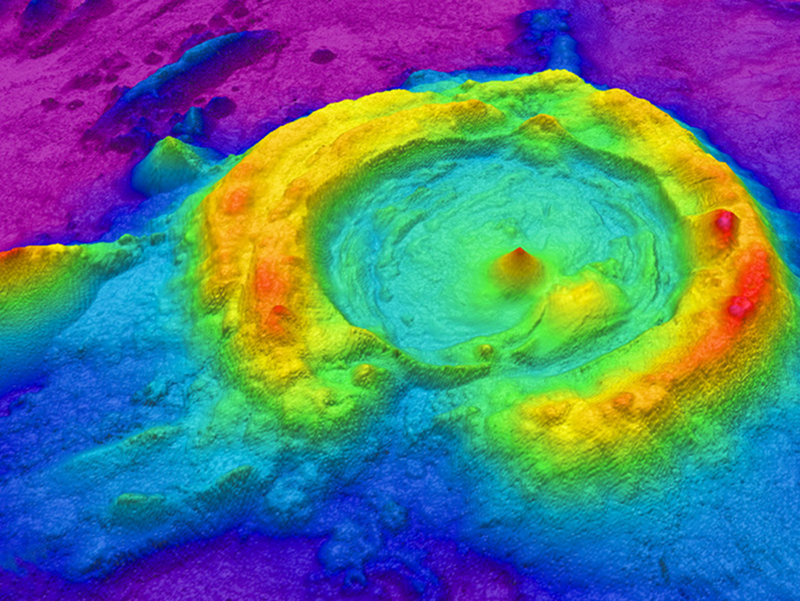
Map of a huge caldera in the NE Lau Basin, created from multibeam data processed with GIS software. Image courtesy of Submarine Ring of Fire 2012 Exploration, NOAA Vents Program. Download largest version (jpg, 165 KB).
A geographic information system, or GIS, is a computer-based conceptualized framework used for organizing and analyzing data related to positions on Earth’s surface. By organizing data spatially along with tabular data (also referred to as attribute data), GIS can increase our understanding of the ocean. Instead of just displaying data in a spreadsheet, GIS provides a digital platform for viewing and processing layers of spatial information using maps and three-dimensional scenes. Given enough data, a GIS can essentially create a virtual ocean inside of a computer.
How Does It Work?

Geographic features in a GIS can be created in raster data form. Image courtesy of NOAA/ONMS/Matthew Lawrence. Download largest version (jpg, 59 KB).

Geographic features in a GIS can also be created in vector data form. Image courtesy of NOAA/ONMS/Matthew Lawrence. Download largest version (jpg, 183 KB).
Building a GIS requires a computer with specialized software and spatial data. Two of the most commonly used forms of data in GIS are vector-based and rasters. Vector data use X and Y coordinates to define the locations of points, lines, and polygons (or areas). Points can be representative of the locations of cities, lines may represent rivers and roads, and an example of a polygon would be the boundary of a national park.
Bathymetric datasets, which include information about the depths and shapes of underwater terrain, can be raster files. Rasters are datasets comprised of pixels (also known as cells) that have unique assigned values.
Specialized software is used to analyze spatial location and organize layers of information into visualizations using digital map overlays. Users can use the software to integrate and analyze relationships among all types of data inputted into the GIS.
As a GIS user, you can manage the tools of ocean exploration in much the same way that a conductor leads an orchestra. A conductor manages the unique sounds produced by a number of different musical instruments so that they blend together into a rich, multilayered symphony. Likewise, a GIS user manages unique spatial information produced by a wide variety of ocean-sensing instruments, such as satellites, buoys, sonar, submersibles, traps, trawls, underwater cameras, and other devices, until they be combine to form a multilayered reconstruction of geographic reality.
Why Is It Important?

A bathymetric image of Lake Huron. In the same way that topographic maps represent the three-dimensional featues (or relief) of overland terrain, bathymetric maps illustrate the land that lies under water. Map courtesy of NOAA GLERL. Download largest version (jpg, 660 KB).
GIS has a wide variety of applications, from land-use planning, scientific research, public health management, and even to aid in national defense. Within NOAA, GIS is used for everything from mapping oil spill trajectories to tracking the paths of historic hurricanes.
In terms of ocean exploration, spatial information collected using a wide variety of ocean-sensing instruments, such as satellites, buoys, sonars, submersibles, traps, trawls, underwater cameras, and other devices, can be captured in a GIS to generate a multilayered reconstruction of geographic reality.
The maps and visualizations generated using GIS can help us easily communicate, perform analyses, share information, and solve complex problems around the world.
NOAA Ocean Exploration GIS Data and Products
GIS data and products developed using information collected during expeditions led or supported by NOAA Ocean Exploration are publicly available on a wide variety of online platforms.
NOAA’s GeoPlatform is a GIS application using Esri’s ArcGIS Online service. The website is available to the public for browsing. You can view the different types of data NOAA provides through the platform, organized into several categories, including topics on charting and geodesy, education, oceans and coasts, and satellites.
The Okeanos Explorer – Live Operations Map provides the current location of NOAA Ship Okeanos Explorer, whether it be in port or out to sea, and allows users to follow current ship track lines. The interface also allows users to compare current tracks to historical remotely operated vehicle (ROV) dive locations. An interactive 3-D ROV dive tracks map is also available through the GeoPlatform, providing users with the ability to explore different dive sites and Okeanos Explorer cruise tracklines in relation to bathymetric data sets.
Okeanos Explorer’s ship position and meteorological readings are available through the GeoPlatform in near real time via a feature layer format. A feature layer is a layer which is organized within a database and contains data of similar geographic features. At the end of each expedition on Okeanos Explorer, navigation data is quality controlled and added to the OER Data Access – Tracklines Only layer. The final ship tracklines are accessible and downloadable within the NOAA Ocean Exploration Data Atlas.