By Kate von Krusenstiern - Explorer in Training
May 26, 2015

FIGURE 1: Uncleaned multibeam data. Part of the job of the Explorer in Training is to clean any erroneous data which helps with quality control. Image courtesy of NOAA Office of Ocean Exploration and Research. Download larger version (jpg, 107 KB).
Kate von Krusenstiern here. It has been a full two weeks aboard NOAA Ship Okeanos Explorer. This is a voyage of firsts for me: first time at sea, first time participating in a research cruise, and first time working with multibeam sonar data.
During university, I was fascinated by mapping applications to geomorphology (the study of physical features of the surface of the Earth and their relation to its geological structures), specifically fluvial and glacier geomorphology. Much of my research was fixated on those specific studies. In the last year, however, I developed an interest in ocean exploration, specifically ocean mapping. I’m a curious individual, and the unknown mountain ranges, canyons, ridges, volcanoes, and plateaus that exist on our ocean floor excite me. Furthermore, I believe ocean exploration is unbelievably important because the systematic, guided collection of baseline data is the primary catalyst for scientific inquiries. These curiosities and beliefs led me to the Okeanos, interning with the mapping personnel.
I’m familiar with the instrumentation, information systems, and methods of mapping and analyzing the land, but the process for mapping the ocean floor was a mystery. I quickly learned that working with multibeam and sonar data is a lot like other geovisualization and Geographic Information System (GIS) software: It takes a little bit of finesse, the learning curve is just a little bit steep, but once you get the hang of it, it’s not that bad. The mapping leads currently aboard the Okeanos have been extremely helpful and patient, answering the bounds of questions that arise.
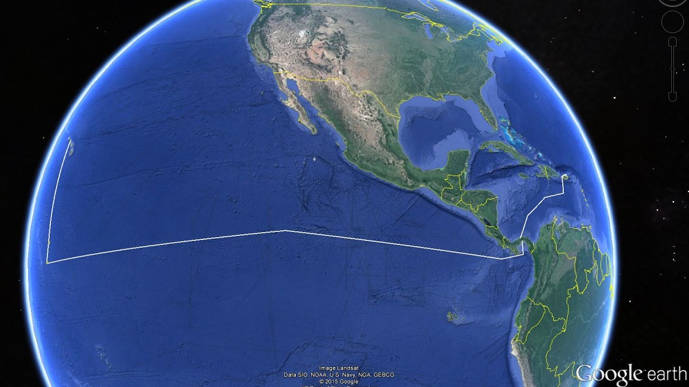
We are currently mapping at a resolution of 100 meters. Since departing Panama City on May 16, we’ve seen seamounts, landslides, ridges, and small canyons. The biggest part of my job is processing the data in a program called CARIS. This means taking artifacts or noise that occurs in the multibeam sonar data and manually getting rid of them. Artifacts, or noise, are a term that describes a depth that is recorded that does not reflect the actual depth (Figure 1). Once fully cleaned and processed, the data is sent to the national archives, where anyone can access the data over the Internet.
In addition to processing the data, I’ve learned how to use other GIS software to gain additional perspective of the features we are mapping. One program, Fledermaus (QPS, Inc.), is used to gain a 3-D perspective of the data. Another, FMGT (QPS, Inc.), allows us to investigate backscatter data that accompanies the multibeam data. Backscatter measures reflectivity, which in turn gives clues to the sediment or bedrock on the ocean floor.
I can say confidently that I’m hooked! I plan to return to academics to earn an advanced degree. Though I am not positive what I want to study, I know that ocean exploration and ocean mapping will make up the backbone of my future of my studies. Until then, I’ll strive to gain exposure, experience, and knowledge in ocean science and exploration. And hopefully, have the opportunity to work aboard another ship.