By Elaine Stuart, NOAA Ship Okeanos Explorer
August 12, 2011
During exploration missions where there is as much geological and geophysical as habitat interest, multibeam backscatter is becoming recognized more and more as an invaluable tool. For this mission, the mapping team is adding a new deliverable to our daily products that we provide to the rest of the science team—a backscatter image draped over multibeam Digital Terrain Model (DTM). So first it should be explained what backscatter is and how it is generated from a multibeam system, such as the NOAA Ship Okeanos Explorer’s Kongsberg EM302.

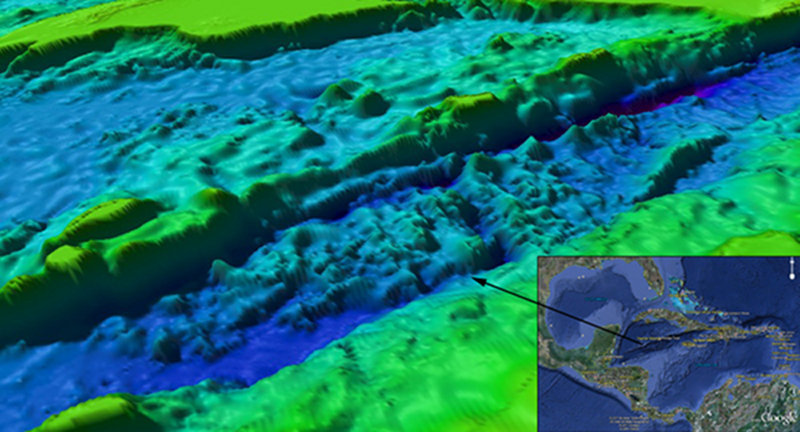
Figure 1: Overview of the working area in the Cayman Trench from Google Earth (lower right) with an arrow showing a detailed oblique view from Smith & Sandwell data (SnS). Image courtesy of NOAA Okeanos Explorer Program, MCR Expedition 2011. Download larger version (jpg, 503 KB).
The seafloor backscatter is defined as the amount of acoustic energy being received by the sonar after a complex interaction with the seafloor. This information can be used to determine bottom type, because different bottom types “scatter” sound energy differently. For example, a softer bottom such as mud will return a weaker signal than a harder bottom, like rock. Multibeam bathymetry on the other hand, provides seafloor depth information and is computed by measuring the time that it takes for the signal to return to the sonar. The Okeanos Explorer’s EM302 multibeam system logs both types of data at the same time. Each beam of each ping collects backscatter data that is referred to as a “snippet”. The two types of data are co-registered, meaning they are geographically referenced together, ensuring the backscatter snippet data will always be shown in the right place on the seafloor. This is an improvement over traditional sidescan sonars, where reliable positioning the data on the seafloor is more difficult. Both in acquisition and processing, backscatter imagery is typically displayed in grayscale and the EM302’s data collection software keeps this association.

Image courtesy of NOAA Okeanos Explorer Program, MCR Expedition 2011. Download larger version (jpg, 1.8 MB).

Image courtesy of NOAA Okeanos Explorer Program, MCR Expedition 2011. Download larger version (jpg, 2.5 MB).
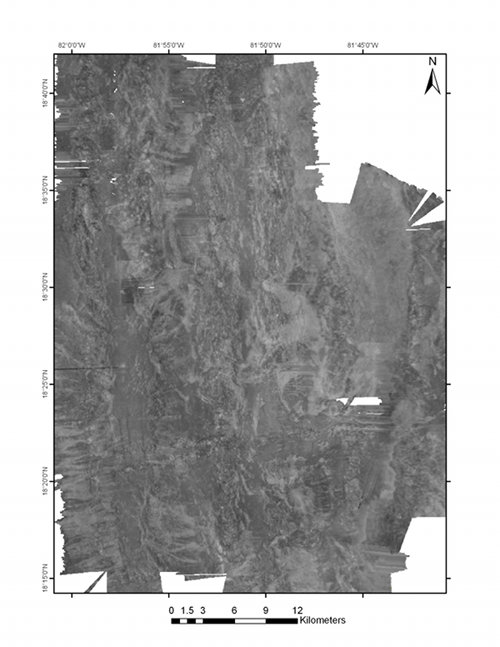
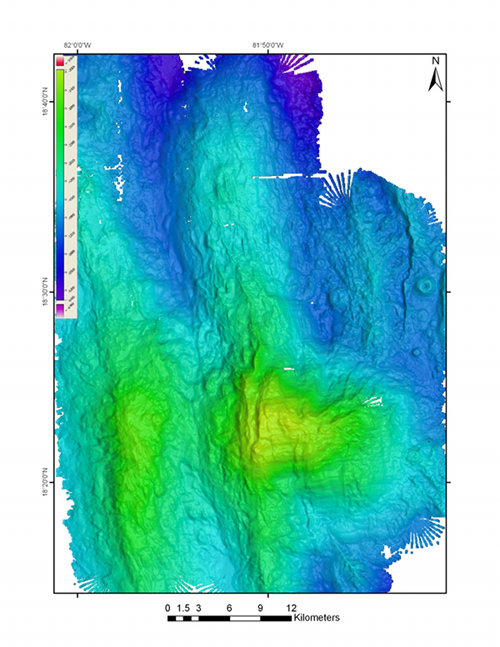
Figure 2: Backscatter (left) and multibeam (right) 50m grids of the same area around Mount Dent collected by the EM302. These two images, although generated from the same data file, provide very different information about the same area of the seafloor.
Multibeam backscatter has more to offer than simple practicality. Before there was the option of multibeam backscatter, sidescan sonars were used solely to determine seafloor type determination (one among many of different types of ocean research). This requires a towed instrument to acquire data from a specific point in the water column in between the ship and the seafloor. This changes what on the seafloor is ensonified because a towed body will produce shadows from looking at only one side of every object. With multibeam backscatter, there are no shadows because the sonar head is on the ship’s hull and looking down over objects from a higher angle, instead of from one side or another. Both methods can offer important ways to determine bottom type but now with multibeam backscatter there is another data collection option available in the exploration toolbox.

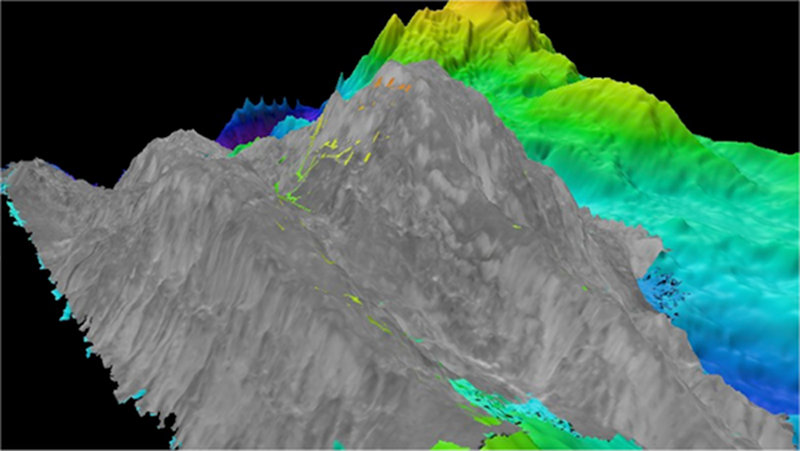
Figure 3: Oblique view of the backscatter draped mosaic of the data featured in Figure 2 which brings together both the snippet and depth information into one nice image. The backscatter mosaic is draped on top multibeam data and is shown over data provided for EX1104 of the working grounds by the science party. Image courtesy of NOAA Okeanos Explorer Program, MCR Expedition 2011. Download larger version (jpg, 401 KB).
The backscatter data collected by EM302 is processed onboard using an IVS software program called FMGT, which stands for Fledermaus GeoCoder Tool—originally developed, in part, at the Center for Coastal and Ocean Mapping (CCOM) at the University of New Hampshire—one of OER’s partners. The raw data files are directly uploaded into FMGT and then rendered into a mosaic (see Figure 2). Combining both the bathymetric and backscatter information results in a Fledermaus 3-D data object (see Figure 3) that can be viewed to analyze backscatter data with heights as well as all the returned acoustic energy information. This has been incredibly helpful for the science team on this mission—using the data acquired to help plan upcoming dives.