By Chris Goldfinger - Marine Geologist/Geophysicist - Oregon State University, Marine Geology Active Tectonics Group,
and Samuel Y. Johnson - U.S. Geological Survey
September 25, 2010
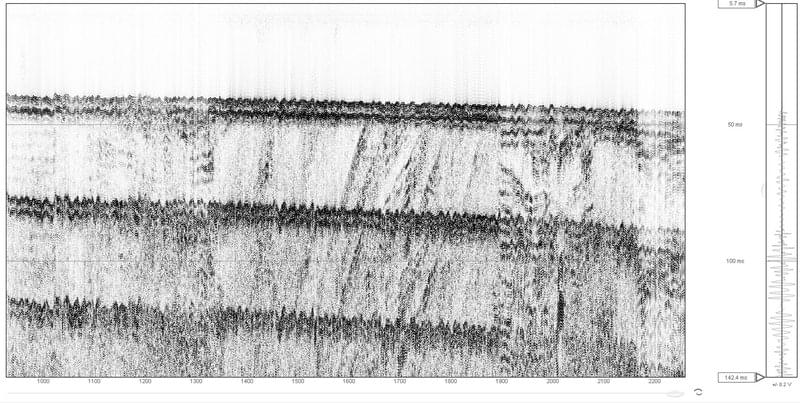
We’re now collecting about 50 “seismic-reflection” profiles across the Northern San Andreas Fault (NSAF) to image the subsurface structure of the fault zone. These lines, collected on 1- kilometer grid perpendicular to the fault, are created using sound waves as with the multibeam, but the sound source in this case is more powerful, penetrating the seafloor and bouncing back from “reflectors” of harder material below. We are using a system called a “mini-sparker”, which sends high voltage to a towed array that generates bubbles and thus sound for each “shot”. The shots are every half second or one second in deep water, and you can hear them through the hull, and hear the sound bouncing back from the bottom shortly after. The difference in hardness of the subsurface layers results in sound bouncing back (reflecting) as discrete sound waves through the water column, where the returning sound is recorded by a set of towed geophones. The data from the geophones are received and plotted on a computer screen as a cross section of the fault, revealing the structure of the fault, and the deformed sediments surrounding it.

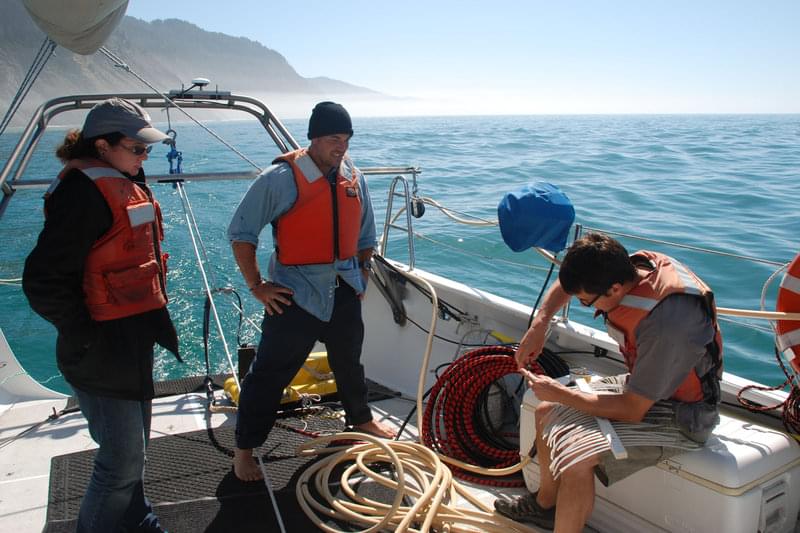
Jackson Currie from USGS trims the ends of the sparker while Bran Black and Tim Kane from OSU observe. Salt water erodes the electrodes at the ends of the sparker and they must be trimmed every few hours to ensure accurate data collection. Image courtesy of San Andreas Fault 2010 Expedition, NOAA-OER. Download image (jpg, 160 KB).
Basically, we are creating a sonogram of the uppermost part of the earth’s crust. Later post processing will improve the quality of what we are seeing in real time on the boat, but we get quite a good picture as we go along. We use the multibeam bathymetry to show us where to locate the lines, and correlate fault features we see in both datasets as we go.

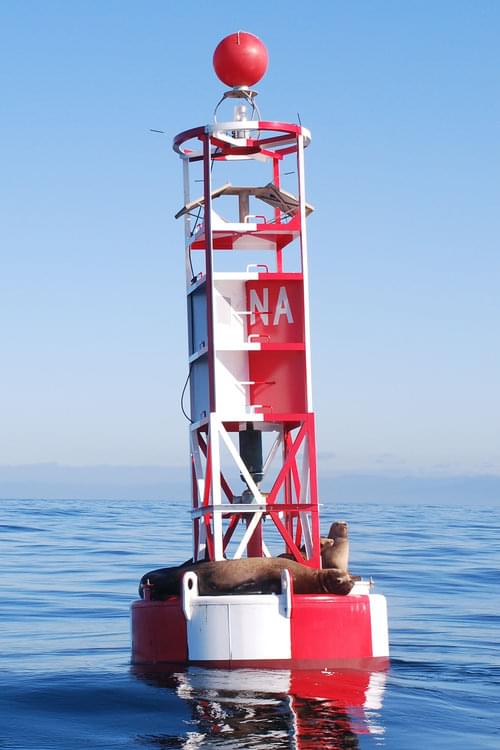
Sea Lions lounging on navigational buoys are a common sight in the coastal waters of the North Pacific. Image courtesy of San Andreas Fault 2010 Expedition, NOAA-OER. Download image (jpg, 101 KB).
So far, we see that the NSAF appears to come ashore in Shelter Cove, is a very linear feature with a few notable bends, and varies from a narrow fault zone to a fairly wide zone of hundreds of meters width and multiple fault strands in some places. The intersection of the fault with land at Shelter Cove that we’re observing appears to resolve a controversy about where the fault goes from Point Arena northward. Some reports have shown this plate-boundary fault bending to the west, and others have disputed the Shelter Cove location, despite observations of offset there after the 1906 earthquake.
Bends along the fault appear to generate uplifted banks from the geometry of the bends, controlling the locations of rocky outcrops, and also the biologic diversity and productivity that goes with them. We started the seismic survey in Shelter Cove and are working our way southward along the fault toward Fort Bragg, where we will connect with another grid of seismic lines collected by our USGS research partners earlier in the summer.

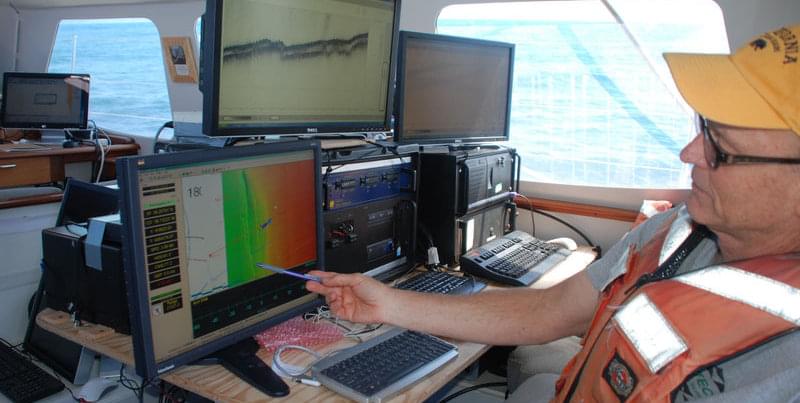
Sam Johnson from USGS points out the location of the San Andreas fault on a map generated by multibeam data to correlate with the incoming seismic data. Bathymetric and backscatter data obtained from multibeam sonar are used to determine seafloor depth as well as indicators of the type of sediment (hard or soft bottom) that is below. Image courtesy of San Andreas Fault 2010 Expedition, NOAA-OER. Download image (jpg, 100 KB).

A seismic profile of one of the fault zones surveyed. Image courtesy of San Andreas Fault 2010 Expedition, NOAA-OER. Download image (jpg, 127 KB).
As we go along we keep a watch for marine mammals, and are required to shut down the sound source if they are within 130 m of the vessel. So far we’ve seen very few marine mammals other than the ubiquitous California Sea Lions that sleep on the navigational buoys near Noyo Harbor and Shelter Cove.