By Sheli Smith, PhD - PAST Foundation
October 27, 2010
Tina Enderlein first came to my attention through emails. This incredibly organized woman kept the entire crew on track making sure we submitted myriad forms, took online courses for NOAA, and got inoculated. She was tireless and yet always nice. Yesterday I got to meet Tina as the crew changed for the second leg of the Lopelia II cruise. At first I didn’t put the name and person together until I watched her helping everyone get organized. Since one of the key facets of good science is good organization, I thought Tina would be a great place to start asking people how they became involved in this cruise and why.

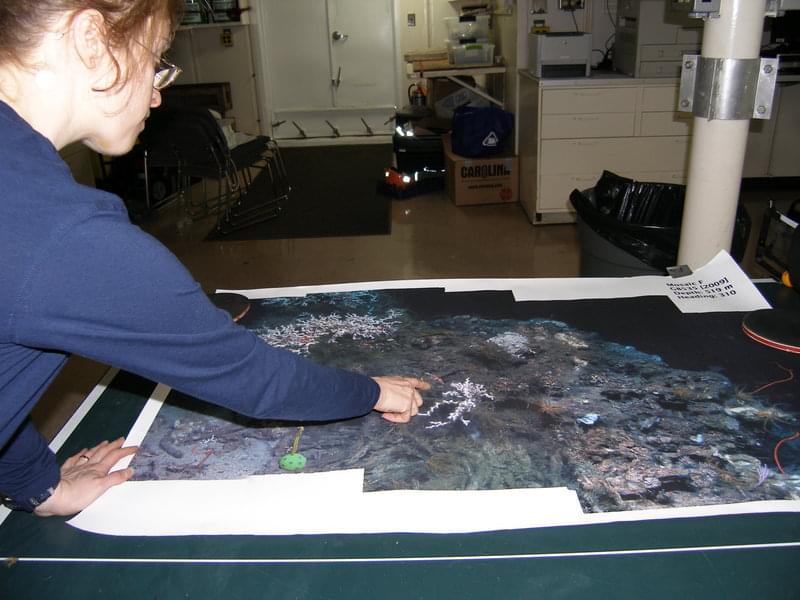
Large scale photo mosaics help scientists relocate sites that have been previously studied. Image courtesy of Lophelia II 2010 Expedition, NOAA-OER/BOEMRE. Download larger version (jpg, 2.7 MB).
Turns out, Tina is from Pennsylvania born and bred. She comes from the small community of Jonestown. She started college as a Political Science major, but in her second year, after taking a geography course from a great professor, changed her major.
“I liked social science, but after taking my first geography course found I liked science, too. Geography had so many possibilities both in science and social science, I felt like the sky was the limit.”
From a GIS course in college Tina found a career path that makes her happy. Since earning her Bachelors degree in Geography and doing her graduate work in Geo-Environmental Science, Tina has worked with the Pennsylvania Parks mapping trails, engineering firms and Penn State University. She currently works for Dr. Fisher in his lab at Penn State University.
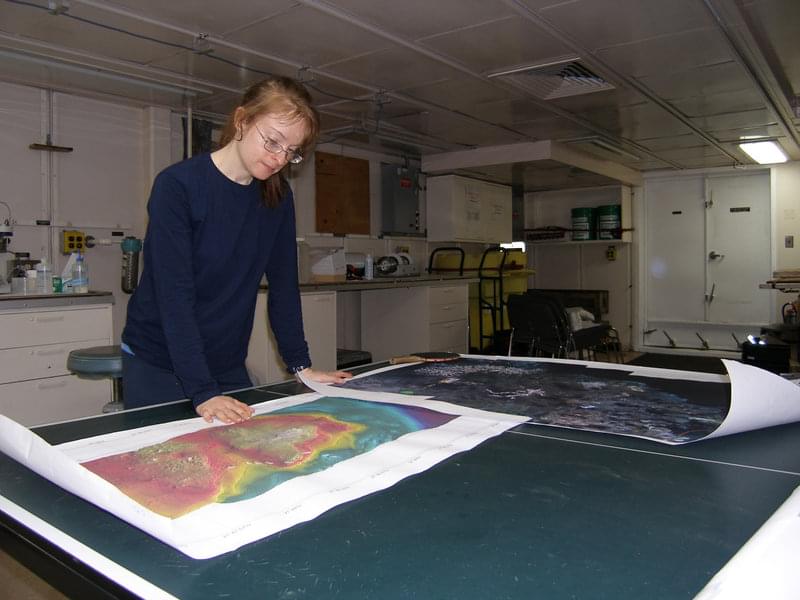
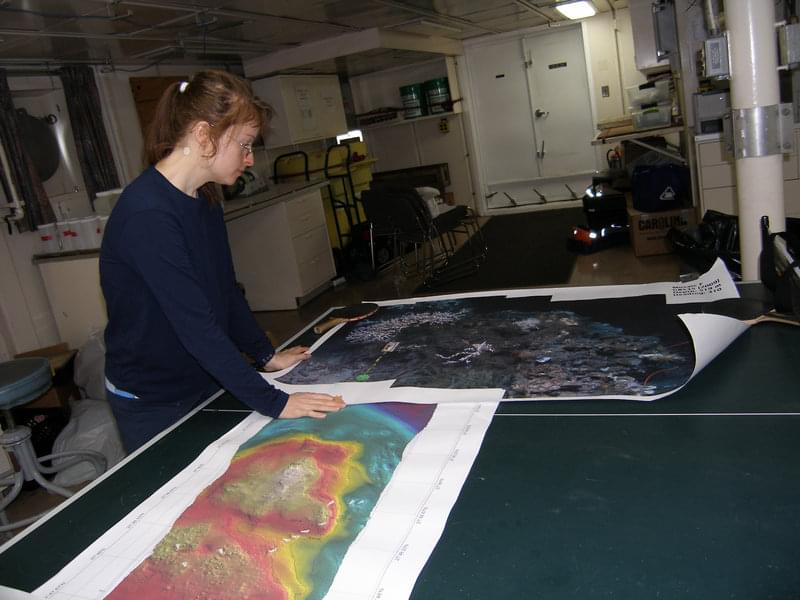
Tina wears many hats at the lab. She uses her GIS expertise to help with the photo mosaics and to organize data. She loves the team environment and helping others organize their data so that they can analyze it spatially: “I love the challenge of understanding new data.” Without doubt she was key in organizing all of us to make it to the second leg of the cruise. Last night it was Tina’s large mosaic maps that helped the pilots and scientists identify a colony of Lophelia from an earlier cruise. No one had any great hope of relocating the site since it was accidently left unmarked. Yet, with the clarity of the photo mosaic and the combined efforts of the Jason pilots and scientists, they found the colony on the first pass and were able to gather data for another mosaic of the area that can be compared and contrasted with the former.

Bathymetric maps guide scientists as they explore the seafloor for coral and reef sites. Adding color to the maps provides visual cues. Later collection data and marker data can be added to the GIS information creating enriched visual information systems. Image courtesy of Lophelia II 2010 Expedition, NOAA-OER/BOEMRE. Download larger version (jpg, 2.7 MB).

Photo mosaics are created using a series of photographs that overlap along a straight transect. Several transects are then “stitched” together to form the overall picture. Image courtesy of Lophelia II 2010 Expedition, NOAA-OER/BOEMRE. Download larger version (jpg, 2.7 MB).
Tina has a very busy schedule. She is the proud mom of a three and half year old daughter and still manages to teach GIS in Continuing Education, as well as yoga and Pilates.
“Take advantage of internships. You get great experience and chances to do things like come on scientific cruises.” Tina took advantage of internships out of college that led her to a career of jobs that have made her happy and fed her inquisitive mind. When asked if she ever had a job she didn’t like she laughed, “I was not happy as a waitress. Then again, I wasn’t very good at it.” Her parting thoughts before she hopped up to find files for one of the scientists were, “You won’t know whether you like something until you try it.”
A geographic information system (GIS) is an integrated system consisting of hardware, software, and data. A GIS allows us to view, understand, question, interpret, and visualize data in many different ways that reveal spatial relationships, patterns, and trends. A GIS allows visualization of tabular data in the form of maps, graphs, reports, and charts. The benefit of a GIS is that it helps us to answer questions and solve problems by looking at data in a way that is easily understood.