By Donna Blackman, Scripps Institution of Oceanography,
Christopher German, Woods Hole Oceanographic Institution,
and Ashlee Henig, Scripps Institution of Oceanography
March 3, 2010
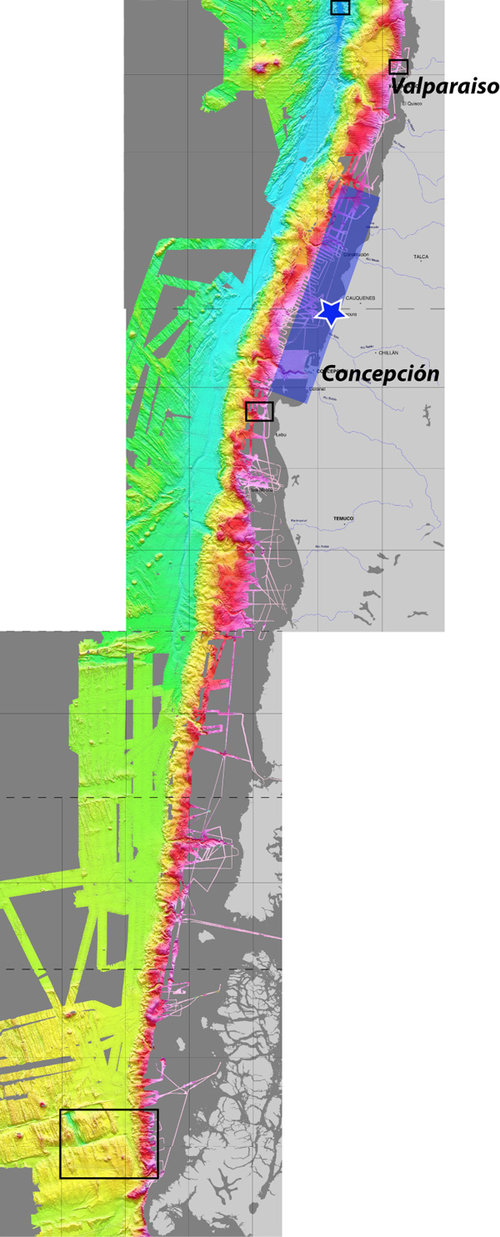
Today we are mapping and sampling offshore along the Chile margin, a few hundred miles south of where the recent earthquake occurred. Both here and near the earthquake epicenter, the seafloor deepens steeply where the oceanic Pacific plate subducts (sinks) beneath the continental South American plate. Shifting of these huge tectonic plates caused the earthquake. Deformation and associated landslides at the edge of the continental slope generated the tsunami.

Figure 1. This Chile margin map shows seafloor depths from 600 to 6,000 meters (1968 to 19,685 feet) in color (pink to purple), our study areas (black boxes), the recent earthquake epicenter (star), and the approximate area of the fault that slipped during the earthquake (blue box). The steep slope where landslides occur is indicated by the rapid color change (from red to yellow). Image courtesy of INSPIRE: Chile Margin 2010. Download image (jpg, 139 KB).
The sonar system we use for mapping tells us the shape, depth, and something about the character of the seafloor. Each pulse of sound (a "ping") goes from the ship to the seafloor and back. If the seafloor has new sediment on it, some of the energy from the ping is absorbed and only a quiet echo will be heard (and recorded) back at the ship. If the seafloor is hard or steep, a stronger echo will be recorded at the ship. To map deformation and landslides caused by the earthquake and aftershocks, we will look for sharp, curved landslide scarps (denoted by strong echos) and for jumbled piles of rock (a mix of strong and weak echos) at the base of the slope.

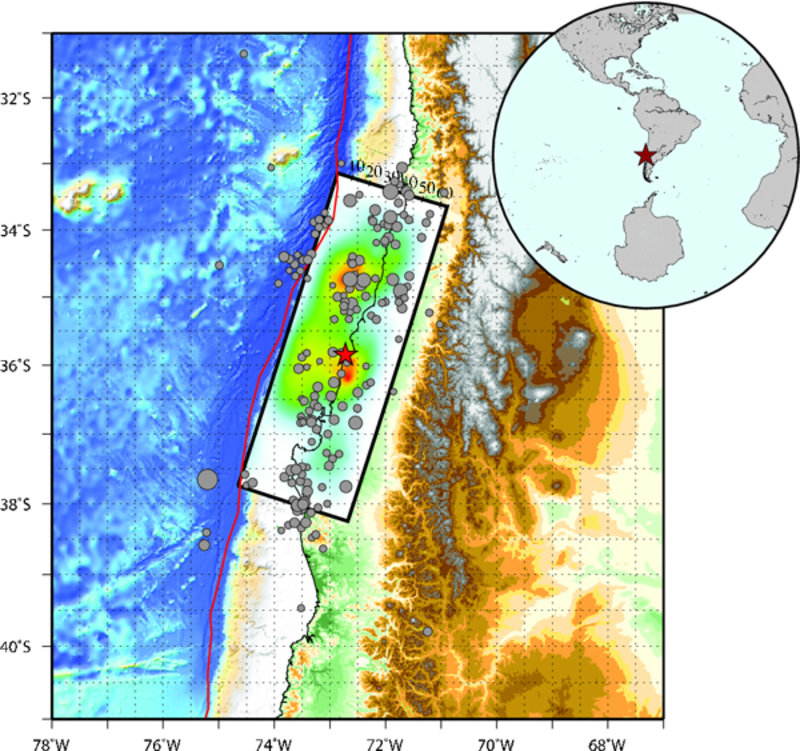
Figure 2. The U.S. Geological Survey (USGS) determination of slip along the fault plan. Maximum slip (shown in red) on some parts of the fault exceeds 12 meters (39 feet). Image courtesy of US Geological Survey. Download image (jpg, 184 KB).

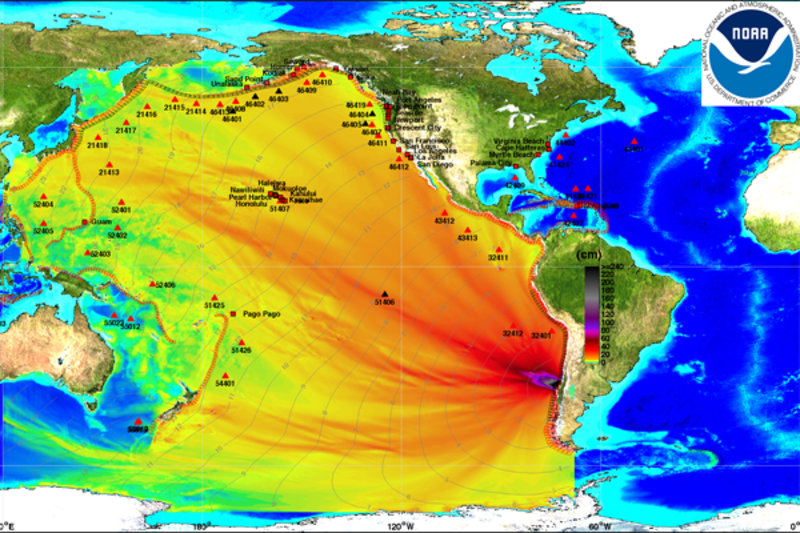
Figure 3. The predicted height (shown in color) of the tsunami and the time that it would arrive (gray lines). Image courtesy of NOAA Center for Tsunami Research, NOAA /R/PMEL. Download image (jpg, 166 KB).
This margin (and many around the world) have an additional factor — the presence of methane hydrate frozen within the crust of the slope. Usually the hydrate layer is a few hundred meters below the seafloor and associated fluids/gases percolate up slowly, seeping out in small areas at the seafloor. A large landslide on the slope can break through the hydrate layer and provide a direct "escape" route for the methane. Addtionally, fracturing and vibration due to passing seismic waves from the earthquake could trigger new flow channels within the slope allowing gas to escape.
So, in addition to the sonar data, we will be looking carefully for signals in the water just above the seafloor that could indicate bubbles escaping from new methane emissions. If we do see an area of strong bubble emission, and our chemical sensors detect methane, we can design a detailed study that the underwater vehicle ABE will conduct.
As we wrap up our work in the south, we will sail north where we will be working above the location of the great earthquake occurrence. During our transit through this area, we expect to get an initial idea of the scope of offshore deformation and, perhaps, the extent and location of some landslides that may have been associated with the tsunami.