


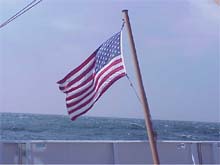
The Ron Brown’s flag flying on September 11th, 2002. On this day of remembrance for the country, we sat at anchor off the coast of Long Island waiting out Hurricane Gustav. Click image for larger view.
The Winds of Change
September 11, 2002
Lisa M. Weiss, Watershed Coordinator
Jacques Cousteau National Estuarine Research Reserve
I wish all the best to the people affected by the September 11th, 2001, attacks. On the one-year anniversary of this tragedy, it is important for all of you to know that you have national and worldwide support, ensuring that another tragedy such as this can never occur again. Although we were not on land to participate with all of you on this National Day of Remembrance, Patriot’s Day, the thoughts and faith of us on the Ronald Brown are with you. The best to all in this time of remembrance for our heroes of September 11th.
Aboard a ship you have to be very aware of weather conditions at all times. For the past few days we have been monitoring a tropical storm brewing in the Atlantic. Tropical storms and hurricanes have terrible impacts on land, but when they reach land, the winds associated with these storms often are weakened by structures. Out at sea, the winds encounter nothing to slow their speed and forces. Currently we are at anchor, sitting three miles offshore of Long Island, NY, waiting out Hurricane Gustav.
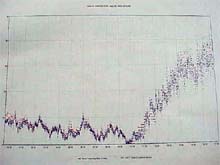
A graph showing the wind speed changes during the morning hours. Wind speeds can be determined both by an anemometer and by the Beaufort scale. Click image for larger view.
Weather at Sea
The Officers aboard the Ron Brown follow reports and warnings issued from the Naval Atlantic Meteorology and Oceanography Center, also known as NAVLATLMETOCCEN. The ship receives information such as weather diagrams, projected storm tracks, isobar charts, wind speeds and directions, and satellite photos. (Isobar charts are weather charts that indicate lines of equal barometric pressures, similar to the way that topographic contour charts connect points of equal depth.)
Wind speeds can be reported in either miles-per-hour or in knots. The wind speed can be determined in two ways. An anemometer, or wind gauge, is an instrument that determines both wind speed and direction. Another way to determine wind speed is by the Beaufort scale. Sea conditions are compared against pictures and descriptions in a guidebook. Sea surface conditions are rated on a scale from 0 to 11 with zero being the lowest wind speed and 11 being the highest wind speed. A range of wind forces is included within these ratings. This method is subjective, meaning that it depends on a person’s idea of the conditions rather than exact wind speeds. The Beaufort scale also does not indicate the direction of the wind.
The officers must be able to interpret all of this weather data and forecasts, and make a decision that will both keep the ship safe and will allow for data collection to last as long as possible. For Tropical Storm Gustav, they listened to the weather radio and the forecasted sea states and followed the intended storm tracks. On September 9th, the Navy issued a warning to mariners within a projected area of the storm track to seek refuge at a “safe haven” around the New York City area. The storm was projected to reach our survey area by the night of September 10th, and they were forecasting wind speeds indicative of hurricane strength by the time of its arrival.
Impacting the Science
Because this was our last week of our exploration cruise, a run into the New York City area did not fit too well into the mapping research strategy. We have come close to mapping our “priority area” for the Hudson Canyon (the 60 X 100 mile grid), but we still need to re-map some areas and hopefully add new areas to our survey. After hearing the warning issued by the Navy, a decision was made to continue mapping and data collection for as long as possible, leaving enough time for us to make our run into the New York City area before the storm arrived.
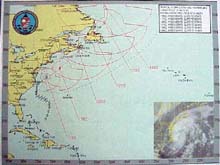
A hurricane forecast chart indicating the direction, predicted area of movement and wind extents from Hurricane Gustav. Inserted at the bottom right is a satellite image showing the circular cloud formation associated with tropical storms and hurricanes. Click image for larger view.
On September 10th at 5:30 pm, we began our run into New York, and none too late! Over night the tropical storm increased in strength and was renamed a hurricane. (The distinction between a hurricane and a tropical storm is the wind speed. If winds are sustained at 73 miles per hour or more, it is referred to as a hurricane.) This morning began with very foggy and humid conditions, but calm seas. As the morning passed, the winds increased causing the seas to increase, but the skies cleared. The day actually turned out to be quite beautiful, except for the winds gusts that reached around 40-45 miles an hour, and we were even very close to land!
We are currently anchored about three miles offshore of Jones Beach, Long Island, NY. We can see land from where we are, and even witnessed Air Force One flying President Bush into the city to be with the family members of people that perished in the terrorist attacks of last year. Over the course of the day, we have had to increase the amount of anchor chain, hoping to keep the ship sustained in our current location. We currently are “holding anchor” with four “shots” of chain out. Each shot is 90 feet of anchor chain, meaning that we have a total of 360 feet of anchor chain out, attached to a 4500-pound anchor!
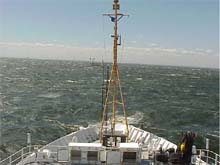
A picture of the sea state taken from the bridge aboard the Ron Brown. Our weather today began foggy but calm, and quickly turned to strong gusty winds with relatively clear, sunny skies. Click image for larger view.
We do not know how Hurricane Gustav will affect our science tasks. We are going to hold our position at anchor for the night and hope that as the hurricane moves through, the seas will calm and we will be able to resume mapping. Although mapping of the priority area is mostly completed, there are some tracklines for which the quality of data was not high. We would like to go back to these areas and re-survey. We would also like to run some dip-lines, or lines that run perpendicular to our original tracklines, so that we can view the sub-bottom profiles three-dimensionally. Another area of data collection that we would like to include is in the shallow shelf area.
In reading the “Ask the Explorer” questions, you learned that when weather conditions cause us to stop our data collection, we do not get a chance to get those lost days back. We are at the mercy of the weather for the next few days. Stay tuned!!!
Sign up for the Ocean Explorer E-mail Update List.