


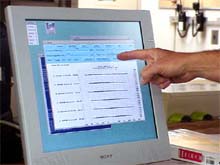
Tom Bolmer points to the computer screen on which we will be editing the multibeam data for any outliers that may occur in the data collection process. Outliers are data points that fall outside the normal range of the other points and can be thrown away. These errors in data collection can occur just like any computer system can have temporary lapses in processing correctly. Click image for larger view.
Let the Research Begin!
August 30, 2002
Lisa M. Weiss, Watershed Coordinator
Jacques Cousteau National Estuarine Research Reserve
“Like the discipline itself, the fieldwork of oceanography required imposing on the natural world an intellectual order that was truly cognizant of the sea’s dynamic nature…If you send a weak idea to sea, it will almost certainly come back mangled…to experience the ocean so often and under so many conditions that it provides the texture and pattern’s of one’s consciousness, can’t help but encourage a reality-based style of theoretical inquiry.” – David Dobbs: The Great Gulf
This morning we have made it to our first station where we will begin with CTD sampling of the water column and the seafloor mapping will get underway. This is just the beginning of the research portion of the trip, despite the fact that we have been underway for about three days now. I can assure you that the science crew is ready to begin!
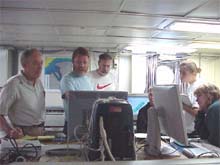
Tom Bolmer holds an editing meeting with the members of the scientific crew to discuss how the multibeam mapping data will have to be edited. We will all have to take an active role in the editing process, as we will be collecting mapping data of the Hudson Canyon for the next 14 days, 24 hours a day. Click image for larger view
Before we can jump into the data collection, it is important that all of the science crew is made aware of the data that will be collected, the enormous volume of the points that will be associated with all that data, and the ways in which we can correct for glaring errors in the data as we receive it. The job that we are undertaking is huge. As mentioned in an earlier log, we will be running tracklines over an area of the ocean that is 60 miles wide and about 100 miles long, continuously for 14 days. Associated with all of these tracklines are acoustic pings that are sent to the bottom of the seafloor, reflect off the seafloor and then received again by the ship. One ping is sent out at a time, which creates 150 beams. Based on the distance between the time the ping was sent and the time the pings were released, the depth of the seafloor is calculated. The collection of lines is know as a swath. There is one swath per sounding line. The swaths and geographic positions produce the bathymetric map.
Each set of swathes that are sent out, and all the pings that are associated with those swaths are recorded onto a computer and are analyzed in a few ways. One way is by looking at individual pings as they are received back to the ship. The pings are illustrated as a series of points along a line, and when the lines are stacked together, they represent the topographic data. This point data is a collection of time, range, position and slant data. Like all electronic equipment, the SeaBeam equipment collecting our topographic data can malfunction and record erroneous points—outliers—that fall outside of the normal pattern of the data. We must identify these outliers and remove them from the data, ensuring that we are left with a quality data set. This editing procedure will be done for all the data, for all the points, for the duration of the mapping part of the cruise (24 hours a day, for 14 days!) A huge amount of editing!
The other way that the ship receives data is in a much more visual and pictorial way. With the SeaBeam image software, the data from the pings are translated in a way that the variations in the time of sound reflection (e.g., the depth of the seafloor) are seen as variations in color over a gradation scale. As the topography changes, the color scales change. This type of software allows us to make illustrations of bottom topography as the ship moves along its track, and is much more understandable to the untrained eye. Both types of data analysis use the same data. It is the visualization of that data that changes.
Last night the science crew presented our research goals to those people aboard the ship that were interested in knowing the background of our work. We all gave short presentation of our purpose on the ship and answered questions from our fellow shipmates. It is through our interactions with them that our scientific research will be able to begin, our cruise will be most enjoyable, and our data will be of the highest quality. We feel lucky to have the opportunity to work with this ship, the finest research vessel that NOAA has to offer the scientific community. Let the research begin!
Sign up for the Ocean Explorer E-mail Update List.