


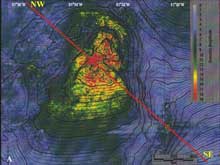
The colors on this reflectivity map describe the hardness of the sea-floor surface. Blue represents soft bottom such as silt or mud, as is the most common bottom type in the Gulf of Mexico. Scientists on this cruise are primarily interested in the yellow and red areas — the hardbottom. Click image for larger view and image credit.
Understanding Sea-floor Geology and Biology in the Gulf of Mexico
Jesse L. Hunt, Jr.
Minerals Management Service
Gulf of Mexico Region
The mission of the U.S. Minerals Management Service (MMS) is to manage the mineral resources on the nation’s outer continental shelf in an environmentally sound and safe manner. The MMS manages mineral resources through the analysis of geological and geophysical data and information acquired through private, public, and governmental sources. Protecting unique and sensitive environmental resources is integral to managing mineral extraction in an environmentally sound and safe manner. To protect such resources, we must first determine where they are located.
As a first step, MMS geoscientists initiated an ambitious program in 1999 to map the sea floor using three-dimensional (3-D) seismic over 76,000 square miles across the upper and lower slopes of the Gulf of Mexico. As a result of this study, we have mapped about 95% of the sea floor in the Gulf of Mexico within the U.S. Exclusive Economic Zone, deeper than about 200 meters (m).
When mapping the sea floor with 3-D seismic, researchers use geophysical software that provides two maps of the study area. One is the bathymetry, or water depth; the other is seismic amplitude, which is the strength of the response of the sound energy bouncing off the sea floor. For example, the response from soft bottom mud that occurs in most deep-water areas is a low seismic amplitude, while the response from hard surfaces (carbonate rocks, hydrates, and benthic communities such as mussel and clam beds) is generally a high seismic amplitude.
We are analyzing this sea-floor information to:
- better understand the distribution of hydrocarbons in the subsurface,
- identify potential hazards to oil and gas drilling, and
- identify areas where hydrocarbons are being vented into sea-floor sediments and the water column, where they provide hydrocarbons for the formation of gas hydrates and the energy for densely populated and lawfully protected chemosynthetic communities.
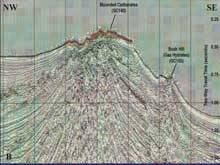
This subbottom profile shows a fluid and gas expulsion site with a highly reflective sea floor. The red area on top of the mound exhibits high reflectivity characteristic of hardbottom areas. The "veins" converging near the peak of the mound provide pathways for the movement of fluid and gas to the sea-floor surface. Click image for larger view and image credit.
The MMS, in cooperation with university personnel and other federal agencies, is also using these data in conjunction with other supporting information to help improve interpretation of sea-floor geology and biology for regulatory purposes. This is particularly important because, by knowing the types of geology that specific organisms tend to be found on, we can use the geological and geophysical maps to begin making predictions about the types of fauna we would expect to see in certain locations. So far, MMS-sponsored field research and geophysical interpretation associated with this expedition indicate that there is a good correlation between strong seismic amplitude response, or anomalies, and the occurrence of chemosynthetic communities. Of the sites visited during last year’s Alvin cruise, our geoscientists used the location of seismic anomalies to predict, with 100% accuracy, where we would find chemosynthetic communities
During this cruise, we will continue the shipboard exploration and research to collect visual documentation and biological, geological, and geochemical samples from a number of these geophysical anomalies.