


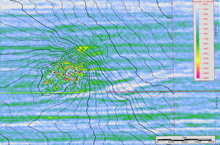
This three-dimensional seismic map of the bathymetry and amplitude of Atwater Valley 340 (AT 340) provides a visual representation of the subsea depth and the strength of the response of sound energy, bouncing off the sea floor. The "hard" returns (shown as red, yellow, and dark green areas) indicate hardbottom habitats — many of which also have chemosynthetic communities. Click image for larger view and image credit.
Pre-dive Geophysical Analysis of Atwater Valley 340
June 9, 2007
Bill Shedd
Minerals Management Service
27° 38.70 N
88° 21.99 W
Federal regulations stipulate that three-dimensional (3-D) seismic data collected for the oil and gas industry be made available to the Minerals Management Service (MMS). Though these data were originally generated by the oil industry to explore for deep oil and gas targets, MMS geophysicists Bill Shedd and Jessie Hunt, and Harry Roberts of Louisiana State University, recognized that these data might be useful in finding sea-floor seeps, as well.
MMS used these data to generate bathymetric maps that highlighted areas in the Gulf of Mexico that showed distinct sea-floor areas of high elevation (mounds) and low areas (depressions). The seismic data for many of these same areas showed anomalous variation in the amplitude, which is the strength of the response of sound energy bouncing off the sea floor. The “hard” areas (which appear as red, yellow, and dark green on seismic amplitude maps, such as the one above at Atwater Valley 340 [AT 340]) have been correlated to hardbottom areas. Chemosynthetic tubeworms, mussels, and clams are commonly found on and around these carbonate rock outcrops. There are also low amplitude spots on the maps. These represent “softer” and frequently gassy sediments. These softer spots tend to be seeps with episodic flow rates and a general lack of chemosynthetic communities. They are usually surrounded by scattered hardground and, sometimes, chemosynthetic communities.
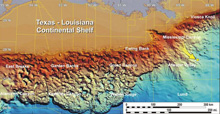
This map provides a general overview of the sea-floor topography in the Gulf of Mexico. AT 340 is highlighted (by a yellow arrow) in the eastern portion of the Gulf. Click image for larger view and image credit.
Both the March 2006 reconnaissance cruise and May 2006 Alvin submersible cruise confirmed our interpretation of the bathymetric and amplitude data. Nonetheless, our understanding was still limited by the coarse horizontal and vertical resolution of the data. (Resolution refers to the sharpness and clarity of the data.) Most 3-D data have horizontal resolution of approximately 15 meters (m) by 30 m, and vertical resolutions of 5 to 10 m. Since many chemosynthetic habitats are below the resolution of the 3-D seismic data, we miss many important details on the scale of 1 to 2 m. Though seismic data are critical in helping us narrow down areas of interest, we need more detailed bathymetric maps to identify many important but subtle features.
Autonomous underwater vehicles (AUVs) are one of several tools that scientists are using to obtain finer resolution data about the sea floor. You’ll hear more about one of these in an upcoming log.