


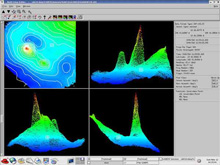
A screen capture, created by Scientific Applications International Corporation's data processing software SABER, depicts bathymetry data revealing a 12 m pinnacle. Click image for larger view and image credit.
Benthic Habitat Mapping
November 13, 2006
Emily Lundblad
GIS Specialist
Joint Institute for Marine and Atmospheric Research
The tides change and so does our mission, as we adapt to the resources we have and don't have. When the laser line scan (LLS) data acquisition came to an end, we were ready to improvise with continued productivity from the ship. In the wake of change, we started a transit to the Big Island to complete the mapping that was left unfinished, simply from running out of time, on the west coast in April of this year. The west coast of the Big Island, particularly the northwest, is of great interest to marine resources managers. The area is part of the Humpback Whale National Marine Sanctuary, includes a large portion of bottomfish habitat (areas from 100 to 400 m deep around all of the Hawaiian Islands), and provides shallow-to-moderate depth coral reef habitats for thousands of marine species. Additionally, the epicenters of the two October earthquakes were recorded off the northwest coast of the Big Island. The epicenter of the smaller earthquake was mapped previously, and we returned to map it again with hopes of identifying any geomorphic change that may have resulted from the earthquakes.
Our goal is to provide marine resource managers with the baseline information they need to make sound decisions that benefit the environment and the people who find subsistence from such environments, and that help preserve Hawaiian culture for future generations. We reach that goal by mapping the sea floor with great detail. Final products are generally provided with 5 m and 20-to-40 m resolution.
A common mission among researchers and scientists is to have seamless elevation maps from mountain top to sea-floor bottom to understand natural resources and occurrences (e.g., tsunami prediction models and the effects on shallow coral reefs by coastal agriculture and infrastructure). In addition to elevation, the landscape (or seascape) is important. We can make maps of sea-floor bottom type just like we have maps of land use for the land we live on.
The resulting maps of the sea floor are essentially an extension of topographic maps that are made from satellite imagery. Because satellites cannot "see" under the water beyond a depth of 30 m (on a good day), we use multibeam sonars to get similar results. In this case, we have two sonars mounted to the hull of the ship. Each one transmits 100 to 250 beams of sound that travel to the sea floor and back to a receiver that translates the travel time of the beam into a depth measurement. The backscatter (intensity of the returned sound) is also recorded and can be used to make valuable inferences as to what the sea floor is made of. If the return is strong, the bottom is harder than where it has a weak return from the softer bottom. The depth data are streamed back to our data acquisition software and output as raw data that we process in near-real time. The backscatter are processed back on shore.
Each line, or swath, of data is processed to flag data that are obvious outliers and anomalies in the data. The figure (shown above) is a screen capture from the data processing software, Scientific Applications International Corporation's SABER. The top left planar view gives us a geographic reference of two pinnacles with nearby depressions (red is shallower, while blue is deeper). The other views tell us that these two pinnacles are on a sloping terrain. With a locator tool, we find that the pinnacle with a point on the top is a remarkable 12 m tall. Such sea floor features often provide protection, food sources, and dwelling places for marine organisms. In other words, they are part of the habitat that marine resource managers are out to understand and protect for sustainability.
Sign up for the Ocean Explorer E-mail Update List.