


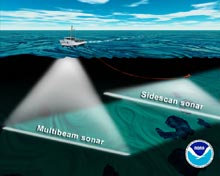
Illustration of a ship using a hull-mounted multibeam sonar while towing a side-scan sonar on a cable. Both sonars map the sea floor in a swath below the ship as it drives forward. Click image for larger view.
2004 Sea-floor Mapping
Bob Embley
Geophysicist
Pacific Marine Environmental Laboratory, NOAA
Bill Chadwick
Oregon State University
NOAA Vents Program
The 2004 Submarine Ring of Fire expedition will rely heavily on the sea-floor mapping accomplished during last year’s 2003 expedition to the Mariana volcanic arc in the western Pacific. Maps of the sea floor created last year will be used this year to plan and carry out dives with the ROV (remotely operated vehicle). Our main goal is to explore the active submarine volcanoes in the Mariana arc, but in order to do that we have to know where they are, how deep they are, and what they look like. The maps give clues about the character and history of each volcano and may reveal enigmatic features that call for closer examination. Maps of the sea floor also provide a physical context for near-bottom observations made during submersible dives. They show the broader submarine landscape beyond what is visible with the lights of the ROV.
In order to “see” volcanoes that are entirely underwater, we used two different kinds of sonars. One system, called the EM300 multibeam sonar, primarily gave information about the depth and shape of the sea floor. The other system, called the MR1 side-scan sonar, mainly provided information about the composition and texture of the sea floor. The EM300 sonar is mounted on the hull of the R/V Thompson and is operated by the University of Washington, whereas the MR1 sonar is towed behind the ship and is operated by the Hawaii Mapping Research Group at the University of Hawaii. During the 2003 Ring of Fire expedition, an area of almost 28,000 sq km was mapped with the EM300 multibeam sonar system, and about 18,000 sq km were mapped with the MR1 side-scan sonar system.
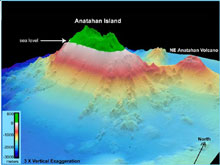
EM300 and SB2000 multibeam bathymetry (35-m grid) is shown in the vicinity of Anatahan Island. The view is looking north-northwest toward the island's southern flank. Click image for larger view and more details.
Multibeam Sonar
Multibeam sonar works by simultaneously sending out multiple sonar beams in a fan-shaped pattern that is oriented perpendicular to the ship’s track. In this way, it maps the sea floor directly below the ship, as well as an area extending outward to either side of the ship. Mapping in this way is often referred to as “mowing the lawn" because each pass covers a fixed width of the sea floor and a regular pattern of tracklines is necessary to cover larger areas. Computers on the ship collect all of this sonar data and then process it to make two- or three-dimensional maps that help visualize the shape of the sea floor.
Side-scan Sonar
Side-scan sonar is different in that it gives information about the character of the sea floor rather than just its depth. Side-scan sonars send out sound to either side of the ship’s track, and then listen for the echoes that are reflected back. How much sound is reflected back (the “acoustic reflectivity”) depends upon the composition, roughness, and slope of the sea floor. This reflectivity information is usually displayed in a black-and- white map, with black representing areas of high reflectivity and white representing areas of low reflectivity. Lava flows, for example, usually show up as dark lobes in side-scan maps, because they are rough and solid and provide a good surface for reflecting sound. In contrast, sandy areas appear relatively light in side-scan maps because the sediments absorb sound instead of reflecting it. Side-scan data also provides information about sea-floor structures because features like fault scarps reflect a lot of sound if they are facing toward the ship, or they cast acoustic shadows if they are facing away from it.
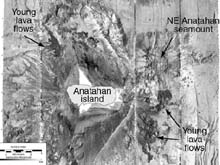
Map of MR1 side-scan sonar imagery around Anatahan Island collected during the 2003 Ring of Fire expedition. Dark areas on the submarine flanks of the island are young lava flows. Map by Paul Johnson, Hawaii Mapping Research Group. Click image for larger view.
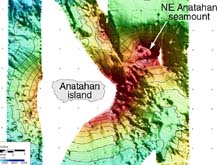
Map of EM300 multibeam sonar bathymetry around Anatahan Island collected during the 2003 Ring of Fire expedition. No hydrothermal activity was found in February 2003 at the neighboring submarine volcanoes, NE Anatahan and S. Sarigan. Map by Paul Johnson, Hawaii Mapping Research Group. Click image for a larger view.
Thus, side-scan and multibeam sonars are complementary systems that provide different kinds of information about the sea floor. Their value as exploration tools is that they allow us to view large areas of the sea floor, identify key areas that we want to study in more detail, and then place submersible observations into a meaningful context.
For a review of the history of sea-floor mapping, see the 2003 Sea-floor Mapping essay.