


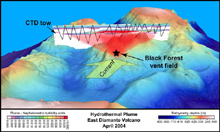
A perspective view of the several eruption cones inside the East Diamante caldera. Our CTD tow (black sawtooth line) mapped out a plume of particles carried southeast from the Black Forest vent field by the local currents (yellow arrow). The scale bar on the bottom left corner of the image indicates the nephelometric turbidity units, an optical measurement of the particles in the water, which indicates the location and intensity of the hydrothermal plume. The scale bar at the bottom right shows the bathymetry depths at the top of the volcano. Click image for larger view.
Measuring the Plume
April 13, 2004
Ed Baker
Supervisory Oceanographer
NOAA Vents Program, Pacific Marine Environmental Laboratory
If you look back at the daily logs our scientists have been writing each day, you will find descriptions of smoking chimneys, bubbling liquids, and expanses of jumbled rocks shimmering under warm fluids gliding upwards into the cold ocean. All of us are devising questions far faster than we can answer them, but there is one question we wonder about at every site: How much? How much hydrothermal fluid percolates through each volcano? How much iron, sulfur, methane, and carbon dioxide are provided to the local biological communities and the surrounding ocean?
Quantifying the hydrothermal process is important but infuriatingly difficult to accomplish. Trying to determine the fluid flow directly at the sea floor is like trying to gauge the flow of the Colorado River by measuring every rivulet in the Rocky Mountains -- there are too many to measure and we don't know where they all are, anyway. Instead, we take the same approach a hydrogeologist would, which would be to place a stream gauge in the Colorado River itself after it has gathered up all those rivulets and streams into a single flow.
Our "Colorado" is the hydrothermal plume that is carried away from each volcano by the ocean currents. Sea-floor discharge is warm and rises like smoke from a forest fire until the combined plume is cooled by mixing with seawater. Once above the sea floor, the plume is entrained into the local ocean currents and swept away. If we make a map of the plume and measure the ocean current at the same time, we can estimate the entire output of a vent field.
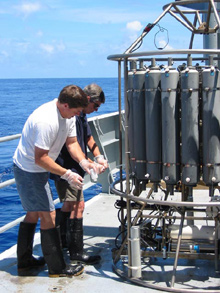
Geoff Lebon (foreground) and Ed Baker (background) remove plume water from the CTD bottles after a tow-yo. Click image for larger view.
The three-dimensional figure above illustrates how we used this technique at the Black Forest vent field on East Diamante caldera. One of our CTD (conductivity, temperature, depth) tows crossed the volcano from southeast to northwest. Luckily for us, the currents were flowing steadily at about half a knot across our track, so the vent field was "upwind" of the CTD tow. We know the current flow pattern because our ship is equipped with an acoustic device that continuously measures the speed and direction of currents in the upper 600 m (about one-half mile) of the ocean.
The concentration of various chemicals in the plume will be determined by analyzing the many samples that we collected along the tow. Finally, a simple multiplication of the concentration of, say, sulfur in the plume, times the current flow, gives us an estimate of the total daily output of sulfur from the Black Forest vent field. Our rough estimate suggests that Black Forest discharges half a ton of sulfur every day!
Sign up for the Ocean Explorer E-mail Update List.