


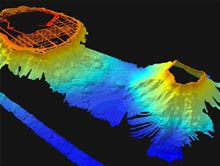
Three-dimensional view of the processed data near Lisianski Island. The feature in the foreground is an unnamed bank. It looks like a cone due to the lack of sounding over the top because we only surveyed the 25 and 100 fathoms contours. Click image for larger view.
Filling in the Gaps
November 12, 2002
John R. Smith, University of Hawaii
Hawaiian Undersea Research Lab
Good weather, conservative planning, and excellent ship handling by the bridge officers have allowed us to finish the required work nearly a week ahead of schedule. This provided us ample time on the return trip to fill in gaps in the seafloor coverage, as well as add more data to the areas surrounding the banks, islets and atolls. In addition, we were able to visit other such features in the Reserve that were not on the original cruise plan, and explore the deeper volcanic regions supporting the shallow carbonate platforms that are of most interest to the Reserve. Coupled with the surveying completed by the Hawaiian Undersea Research Lab ship R/V Ka`imikai-o-Kanaloa on the previous Northwestern Hawaiian Islands cruise, we will have mapped at least the 100 fathom contour at every location from Nihoa Island to Lisianski Island.
So far, we have mapped approximately 4,100 linear nautical miles, which translates into many more square miles due to the large swath coverage generated from the multibeam sonar systems. This figure includes about 3,000 nautical miles of targeted survey areas around the islands, atolls, and submerged banks. The remaining mileage is from surveys during transits between sites, although the transits have often been extended to cover features of interest along the way.
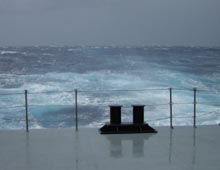
Our first bad-weather day this cruise came unexpectedly while we were near Raita Bank. The strong storm gusted to 55 knots, and generated 20-foot seas. Click image for larger view.
A few things have especially piqued my interest during this voyage. One is the incredible amount of detailed geomorphology—seafloor shapes and structures—that we have been able to discern in the shallow 100 and 25 fathom surveys using the high resolution sonar system onboard the Kilo Moana. These are primarily erosional valleys and canyons cut through by drainage patterns when the emergent features were above or closer to sea level. Some may also represent coral reef formations. We will conduct more detailed data analysis after the cruise to properly map out everything.
The other things that have intrigued me are the deep volcanic rift zones jutting out from beneath the shallow carbonate platforms as long knife-edge ridges. One off Maro Reef even has a circular crater, or depression, at its tip. It was probably filled with molten rock and covered with a hardened crust at one time, though now it has cooled and fully solidified. The other things we have identified are deep seamounts, which are underwater volcanoes that never reached the surface, and submarine landslide deposits from the old volcanic features in the form of scattered debris blocks.
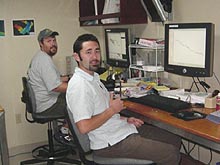
Paul Johnson (left) and Lee Murai take a break from processing data in one of the ships labs. Click image for larger view.
In addition to precisely defining the contours and shapes that will be used to determine the Reserve Preservation Area boundaries, a bonus of this effort will be the updating of the nautical charts for these areas with swath multibeam systems using modern navigation techniques, a far cry from the lead line surveys of the 1930s! This use of the data has been an inspiration for our bridge crew that pilots Kilo Moana. As you might imagine, steering a ship along a track line for seven days a week, 24 hours per day, and for 25 days can become a bit monotonous, especially if you are not directly involved in the scientific aspects of the expedition. They are pleased that their efforts will be of use to other mariners.
All in all, this cruise has been a success on a number of levels because the same data will be applied to several different causes including scientific research, technique development, living resource and sanctuary management, and nautical charting and navigation. Finally, we hope that the fascinating seafloor images we have generated, although not completely covering the underwater world of the Northwestern Hawaiian Islands by any means, will heighten interest in this area and provide the impetus and resources for further study.
Sign up for the Ocean Explorer E-mail Update List.