


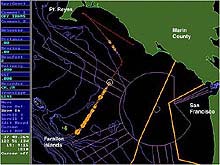
The map shows a wildlife transect through the Gulf of the Farallones and shows the relative abundance of seabirds sighted during the survey. Click image for larger view.
Bird and Marine Mammal Surveys
Gulf of the Farallones
May 22, 2002
Jan Roletto, Research Coordinator
Gulf of the Farallones and Cordell Bank NMS
Two survey tracks are shown in this map. The first track, also called a strip transect, runs from the South Farallon Islands towards the mainland. The ship's track line is in red. The orange dots represent bird sightings. The larger the dot the higher the number of birds at that location.
Most of these sightings consisted of Common Murres, Cassin's Auklets and Sooty Shearwaters. The small blue dots represent the location of jellyfish and drifting algal mats. The jellyfish are food for seabirds, sea turtles and fish. The algal mats are micro-habitats for small fish and collecting areas for drifting plankton, virtually a floating hotel (food and lodging) for some fish and birds. The solid orange lines are the sanctuaries boundaries and the purple lines represent shipping lanes, and the blue lines represent the depth of the water, bathemetry.
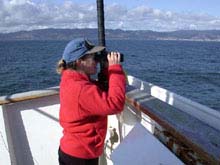
Wildlife observer Jan Roletto looks for seabirds and marine mammals from the flying bridge of the NOAA ship McArthur.
Click image for larger view.
During our surveys we collect oceanographic data, which tells us the conditions of the water. Along the transect running from the islands toward the mainland, the sea surface temperature (SST) was between 10 and 11 degrees Celsius (50 to 53 degrees Fahrenheit). Along the transect line running parallel to the coast and into Drakes Bay, the sea surface temperature was between 11 and 12 degrees. This is an indication that colder SSTs are an important habitat component. In other words higher concentrations of birds are sometimes found at areas of lower SST. Lower SSTs are good indicators of localized upwelling.