


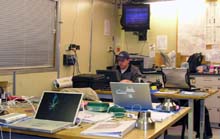
As the science crew's data manager, Chad King adds value to raw data and makes it easier to retrieve and use later. King is also the remotely operated vehicle navigator. Here he works in the dry lab after a busy day's dive. Click image for larger view and image credit.
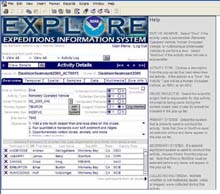
This screen shot shows one of the data entry pages for this cruise. Collecting "information about information" like this, we add a wealth of knowledge about where and when researchers collect samples and make measurements. Click image for larger view and image credit.
The Joys of Metadata
January 31, 2006
Chad King
Monterey Bay National Marine Sanctuary
Working on an oceanographic cruise may sound like something very old fashioned, but modern techniques and data systems are at the heart of what we're doing on the Davidson Seamount expedition. One of my roles on this cruise is being the data manager. That means I keep track of the different kinds of data coming in from all the different scientific instruments, the remotely operated vehicle (ROV), and ship's navigation system, and I put it into a format that others can use. This makes the information we collect much more useful to scientists and policy makers, now and in the future. In other words, I document the "metadata" for our daily activities. Metadata essentially means "data about data."
Let me give you a real world example. On our Day 3 dive, we took some water samples, measured the water currents around some corals, and then collected a few animals. Both during and after the dive, I entered information about the raw data into a database. This information consists of when, how, where, and what we collected or measured, and who was involved. I listed the start and end times of the dive, and the maximum depth we reached on that dive. For the water samples, I entered the time, the depth, latitude and longitude, and the type of bottles used to sample the water. When we took current meter readings with the Acoustic Doppler Current Profiler (ADCP), the metadata I entered included the type of instrument used, time, depth, and latitude and longitude. These last four measurements are also entered for all animal collections, along with the type of animal collected, and how it was collected and preserved.
When researchers look for all this data that I have recorded, it's called "data discovery" — a very apt term, since they can quickly and efficiently find the data they are looking for. From my records, they will know exactly what, where, when, and how the data were collected and who did the collecting! In this way, valuable and important data will be more useful to scientists and policy makers.
My second job on this cruise is as the navigator for each ROV dive. The chief scientist and I plan each day's dive, and we relay the starting coordinates to the ship's captain to navigate the ship to our dive site. We also plan out the path, or trackline, for the ROV. During each dive, I sit at a navigation computer in the control room and inform the ROV pilot in which compass bearing (direction) to fly the ROV.
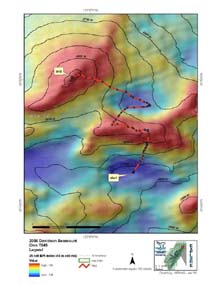
This map shows the two peaks on the northeast end of Davidson Seamount that we explored on Day 5. Geographic information system (GIS) data show our remotely operated vehicle (ROV) dive track (in red), beginning in a valley to the south, traversing over one peak, and ending on the crest of the second peak to the north. Note the smaller dots along the track that indicate significant events along the way. Researchers can now search for information about each of these events in the database. Click image for larger view and image credit.
The navigation computer also displays a real-time position of the ROV and the ship. These locations are entered into the computer and can be combined with other digital information, such as a map showing the contours (peaks and valleys) of the Davidson Seamount. I also enter location points when we encounter something interesting, or when we take a current meter reading, or collect a coral sample.
At the end of each dive, I take the collection of these marked points (e.g., locations, collections, current-meter readings, etc.) and plot them on a map. Each evening on this cruise, I have emailed the day's map to the science crew and then printed it out to show where we made the dive, and where certain events or collections happened.
All of these activities of recording information and metadata are part of a broader concept known as GIS, or geographical information systems. GIS is a powerful way of combining different kinds of information and looking for new relationships between them. For example, when scientists plot the locations of a certain coral species on the Davidson Seamount map and then add the data collected from the current meters, they might discover areas where corals do and don't grow well. In fact, this is one of the goals of our expedition!
Sign up for the Ocean Explorer E-mail Update List.