


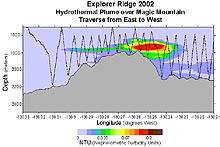
A CTD transect, across axis (from east to west), shows the particle cloud over Magic Mountain vent site. Red NTU values indicate a high amount of particulates within the hydrothermal plume. Click image for larger view.
Exploration Methods Come Together at Explorer Ridge
July 8, 2002
Bob Embley, Principal Investigator
NOAA, Pacific Marine Environmental Laboratory
![]() Watch a 3D fly-through movie that shows the seafloor in the Magic Mountain area of Explorer Ridge, as mapped by the SM2000 sonar system. (mp4, 2.5 MB).
Watch a 3D fly-through movie that shows the seafloor in the Magic Mountain area of Explorer Ridge, as mapped by the SM2000 sonar system. (mp4, 2.5 MB).
Sources and Intensity of Hydrothermal Venting Defined by CTD Data
Hot, particle-laden hydrothermal fluid escaping Explorer Ridge rises like smoke from a campfire until it cools and spreads into the surrounding seawater. Mapping the distribution of this “smoke,” which is actually fine-grained metal oxides and sulfides precipitated from the discharging fluids, provides important clues to the location of the vents themselves. Sampling these plumes provides evidence about the chemistry of the original fluids. The figure shown above was produced from data acquired by towing a CTD instrument package across the strike of the ridge from east to west. The path of the CTD is represented by the dark sawtooth line across the figure. The underlying bathymetric profile is the cross-section that would be produced by slicing the ridge in half like one would a loaf of French bread.
This plume picture is dominated by emissions from the Magic Mountain vent field, which produces a plume almost 200 m thick. Local currents were carrying the plume almost two miles to the east at the time of this tow. We also found evidence that suggests a second, as yet unknown, vent field. The thin plume extending to the west of the ridge does not appear to be connected to the main Magic Mountain discharge. Evidence from other tows and from ABE points towards other vent sites as well, demonstrating that this section of Explorer Ridge is one of the most vigorous hydrothermal areas that we know of in the northeast Pacific Ocean.
Multiple Sensors on ABE Reveal Locations of Hydrothermal Activity
The map below (on the left) shows the calculated magnetization of the ocean crust in the Magic Mountain hydrothermal area of Explorer Ridge. The volcanic rocks that make up ocean crust are typically strongly magnetic because they contain abundant magnetic minerals in the form of titano-magnetite. As lava erupts onto the seafloor and begins to cool, the magnetic minerals within these lavas will preserve a record of Earth's magnetic field at that time. This magnetic history can be preserved for millions of years and has been used to date the age of the ocean basins. At hydrothermal areas like Magic Mountain, however, the hydrothermal fluids passing through the crust are highly corrosive and can rapidly alter and destroy these magnetic minerals. When this happens, a magnetic anomaly low is formed where the fluid has passed through the crust to the vents. Here at Magic Mountain, we find a large circular magnetic low in an area where we believe hydrothermal venting is located. The magnetic low suggests a region about 100 m in diameter located on the east wall of the Explorer Ridge valley. Other areas of low magnetization in the western part of the valley may indicate less focused areas of venting. The second map below (on the right) shows high-resolution bathymetry, collected by ABE, in the same area.
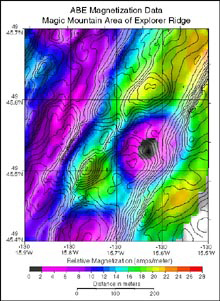
Calculated magnetization of the ocean crust in the Magic Mountain hydrothermal area of Explorer Ridge. Purple and black colors indicate areas of low magnetic values, which help identify vent locations. Black lines are bathymetric contours at a 10 meter interval. Click image for larger view.
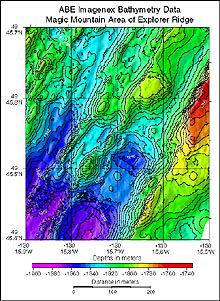
High-resolution bathymetric map of the same area as shown in the magnetization map. Black lines are bathymetric contours at a 5-meter interval. Click image for larger view.
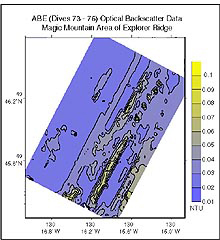
Map of particle intensity from a light backscattering sensor mounted on ABE. Higher concentrations of particles (higher NTU values) help identify locations of hydrothermal vents. Click image for larger view and a detailed explanation.
Light Backscattering Sensor
This is a map of the optical backscatter intensity as detected by ABE in a survey of the northern Explorer Ridge. Optical backscatter is a measure of particles suspended in the water. Because hydrothermal plumes contain a large number of suspended particles, the optical backscatter is a very sensitive indicator of the presence of hydrothermal plumes.
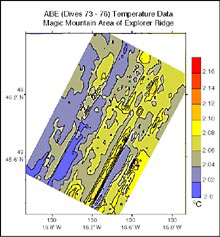
Map of temperatures recorded by ABE. The highest temperature values correlate well with the high particle (NTU) values from the backscatter sensor. Click image for larger view.
Temperature Sensor
This is a map of temperature as detected by ABE in the same survey of the northern Explorer Ridge. Since hydrothermal plumes are slightly warmer than the surrounding water, like optical backscatter, temperature is also a sensitive indicator of the presence of hydrothermal plumes. However, temperature is a little more difficult to interpret, since temperature also varies with depth in the ocean, and the depth of ABE also varied during this survey. Thus, some of the temperature variations indicated in the map are due to depth variations, while others are due to actual hydrothermal plumes. The ambient temperature is about 2.0 degrees Celsius, close to freezing at this depth, and the hydrothermal plumes produce very small increases of 0.1 to 0.2 degrees Celsius above this background temperature.
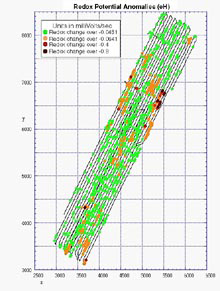
Red and orange dots show where the most chemically reactive water from vent sources were detected along ABE tracklines, shown in black. Click image for larger view.
Electro-Chemical Sensor
Redox potential, or eH, is an indicator of chemical reactivity of any solution, including seawater. Because vent fluids contain lots of ions in solution, vents can be located by sensing decreased eH values. There is a platinum electrode sensor mounted on the bow of ABE to measure eH values. Sharp drops of eH values measured during ABE surveys can help locate new vent sites on the seafloor.
Sign up for the Ocean Explorer E-mail Update List.