


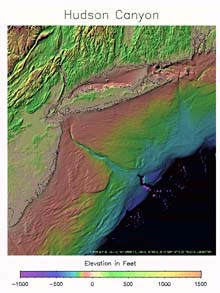
An elevation model of the Hudson Submarine Canyon, illustrating the range and depth to which the canyon extends. The Hudson Canyon is also the valley extending from the mouth of the Hudson River toward the southeast across the continental shelf. The shelf in this area is quite broad. The land north of the canyon is Long Island, and the water just north of it is Long Island Sound.<em> Click image for larger view. </em>
Mapping the Unknown: Seafloor Mapping
Dr. Peter Rona
Marine Geologist
Lisa Weiss
Watershed Coordinator
Rutgers University
Hudson Submarine Canyon is an ancient extension of the Hudson River Valley. It extends over 400 nautical miles seaward from the New York/New Jersey Harbor, across the continental margin, and to the deep ocean basin. Past undersea research explorations have indicated that novel deep-sea creatures could potentially be found in the canyon. Research into this deep canyon may also help us understand how runoff from the major cities in New York and New Jersey may impact the deep Atlantic Ocean. However, the area must be mapped accurately before such research can be adequately carried out. Mapping the deep sea floor, however, is challenging.
Imagine riding in a hot air balloon high above the surface of the earth. You are so high up that you cannot see what the surface looks like. Now imagine tossing a net over the side of the balloon onto the earth’s surface and pulling up sample items from earth, such as a bike, a car, a shoe, a person or a dog. Now imagine trying to determine what the surface looks like just from these netted samples, a challenging prospect indeed.
Marine scientists face this problem every day. Frequently, all that they know about the ocean floor is inferred through the marine organisms that they collect via nets, trawls, hooks and lines, trolling and other methods. But these organisms can only give us a glimpse of the sea floor. For this reason, mapping the sea floor is a critical first step in oceanic exploration. Before we can understand and appreciate the oceans, we must begin to know the surface of the ocean floor. The more data that can be collected to fill in the unknown gaps, the more accurately scientists can interpret the hidden world of the ocean.
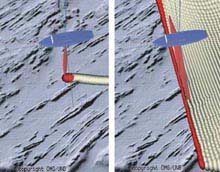
A diagram showing the difference between single (left) and multibeam, “swath” (right) echo sounding on the seafloor. The multibeam system is preferred because it has the capability of measuring an entire region of the sea floor instead of just a single line. This swath system is available on the Ron Brown and will be used on our explorations of the Hudson Canyon..
Seafloor Mapping: How it Works
Before advanced technological tools became available, primitive maps were made by lowering weighted lines into the water at successive single points. The point at which the line tension slackened was determined to be the bottom, and the depth was measured according to the amount of line released. Today, however, the sea floor is remotely mapped using sidescan-sonar and high resolution seismic-reflection profiling. Seafloor mapping surveys provide a relatively sophisticated picture of the sea floor and underlying geology by transmitting a series of acoustic pulses that are reflected off the sea floor and subsurface layers. These signals are then received by a hydrophonic receiving device. The sidescan-sonar surveys provide digital images of the seafloor surface. These seismic profiles are analogous to two-dimensional geologic cross-sections. The vertical scale, however, is in units of time, not distance.
High-resolution seismic and side-scan sonar systems have proven to be immensely important to marine geologists studying deep-sea sediment dispersal paths. In addition, with recent advances in computer hardware and software, data processing has advanced to the degree that most of it can be processed while still on the research vessel.
For example, technology to acquire, process, archive and develop geographic information system (GIS) databases all in the field now is available. In addition, recent advances in swath bathymetry and sidescan sonar make it possible to create dynamic, three-dimensional maps. The U.S. Navy implemented “multibeam sonar” technologies in the 1960s. These arrays of sonar projectors produced soundings not only along the ship's track, but also for significant distances perpendicular to it, thus providing a "swath" of soundings. This ability to collect side-scan sonar data at the same time as the swath bathymetry and the subbottom data has greatly improved our ability to interpret the seafloor geography.
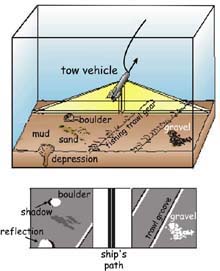
A diagram illustrating the sidescan sonar instrument (top) towed behind a research vessel. The “strength” of the acoustics returned from the sea floor indicates changes in the composition of the materials as the sonar instrument moves overhead. The bottom diagram indicates the data that is created by the towed instrument.
Sidescan Sonar
Sidescan sonar systems work by towing a sounding device behind a research vessel. This towed device emits acoustic sounds that are reflected off boundaries of different mediums. By measuring the intensity of the sound that is bounced back to the ship, we can predict the composition of the seafloor, as well as the size and shape of any vertical components of the floor. This phenomenon is known as “backscatter” and helps to determine the distribution and characteristics of the surface sediments. If there is a strong sound reflection (high backscatter), the surface is usually composed of boulders, gravel and vertical features. If the sound reflections are weak (low backscatter), the bottom is typically composed of finer sediments. The boundaries between the different sea floor materials are displayed graphically in a seismic record, all based on the amount of time that it takes for the acoustical sound source to travel from the towed device, to each material, and back to the receiver.
Sidescan sonar data then must be verified by collecting sediment samples, and taking photographs and video of the bottom. Such "groundtruthing" must be done because sometimes sidescan sonar data can be misleading. For example, a data set that signaled a change in the backscatter intensity may indicate a change in grain size on the sea floor. Photographic data, however, may prove that the backscatter data changed because of the presence of sand dollars, not altered sediment textures.
Thus, with high-resolution maps complimenting the existing data for the Hudson Canyon, future researchers will have the advantage of “seeing” the areas, which will help them better target their missions.
Sign up for the Ocean Explorer E-mail Update List.