


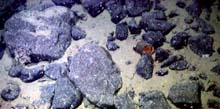
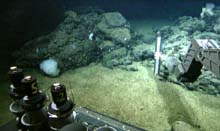
This is a video transect view of a valley on the northeast end of Davidson Seamount. The red laser dots (appearing 29 cm apart on the rock and the rusty can) tell us the size of objects and help us keep the camera view at the correct width during a transect. Click image for larger view and image credit.
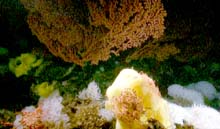
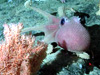
Large bubblegum corals, bright yellow Picasso sponges, white ruffle sponges, basket stars, plus other animals cover the highest peaks of Davidson Seamount. Our team wants to learn why they are found here in such abundance, but less so or not at all in others. Click image for larger view and image credit.
The Flow Hypothesis
February 1, 2006
Jim Barry
Associate Scientist
Monterey Bay Aquarium Research Institute
Ecologists are often curious about factors that influence or control the distribution of plant or animal species. On the Davidson Seamount cruise, we are using the remotely operated vehicle (ROV) Tiburon to perform video transects to measure the distribution and abundance of corals, sponges, and other animals among several habitats and sites along this multi-peaked mountain. The transects are made by “flying” the ROV over the bottom with our camera set to record a swath about 2 m (6.6 ft) wide. Parallel red lasers help us measure the width of the field of view. These transect recordings will be analyzed after the cruise; we’ll count numbers of animals and compare their abundance between habitats.
All over the seamount, we see a striking contrast in the abundance and distribution of large corals at the peaks compared to the nearby slopes and valleys. Many species of corals and sponges thrive on the crests of the shallowest (tallest) parts of the seamount, forming lush “coral gardens.” The bubblegum coral (Paragorgia sp.), in particular, grows to very large sizes (2 to 3 m, or about 6 to 10 ft tall) along the ridge tops of the shallowest peaks (at about 1,300 m below the surface, or almost 4,600 ft), and is smaller or rare on the side slopes and on the deepest peaks (about 2,600 m below the surface, or roughly 8,500 ft). Why?
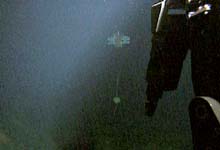
The suspended current meter hangs below its float-pack and beyond the ROV's manipulator arm. Click image for larger view and image credit.
Several factors may influence the ability of corals to colonize different sites and to survive, grow, and reproduce. These might include food availability, oxygen levels, water temperature, or predator and competitor species. One hypothesis we have focused on is that food for bubblegum coral is more abundant along the ridge lines of shallow seamount peaks than in other locations. This would lead to higher rates of survival and growth on ridges, compared to other sites.
Bubblegum corals, like most deep-water corals, feed by capturing organic particles (called "marine snow") suspended in the water that flows past the coral colony. The seamount interrupts the flow of the regional water current, much in the same way that tall buildings change the flow of wind in “downtown canyons.” Because of this, the water flow must accelerate around and over the seamount topography, with the highest speeds expected near the peaks and slower speeds on the slopes and valleys, particularly on the downstream side. Most of us have experienced a similar phenomenon of increasing wind speeds as we hike up over the crest of a steep hill. For a filter-feeder like bubblegum coral, higher flow speeds translate to more food particles sweeping past, and they appear to result in higher feeding rates and better growth and survival.
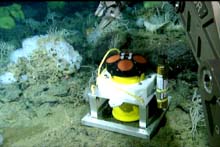
The ROV Tiburon gently sets down a current meter used to measure the water-flow rate on one of Davidson’s peaks. Click image for larger view and image credit.
Tiburon’s manipulator arm holds the silver current meter while researchers take a reading in one of Davidson's many valleys. A rack on the ROV's “front porch” holds push-core tubes used to collect sediment samples. Click image for larger view and image credit.
During this cruise, we are testing this “flow” hypothesis with a series of current-meter measurements, and we are testing the amount of food in the water, as well. Every day, we record the speed of near-bottom currents and the amount of particulate organic carbon (POC) in the water. As its name suggests, POC is the carbon in seawater that is tied up in biological forms (living and dead particles). We’re comparing measurements made on the crests of peaks with others made in nearby valleys.
We use several different current meters to make the flow measurements. On the first day of the expedition, we deployed a mooring (a line with an anchor, float, and instrument package) with a single current meter that floats about 600 m above the seamount. The readings from this suspended current meter will give us an estimate of the flow pattern in the vicinity of the seamount throughout the 10-day cruise. Later, we deployed two other current meters near the bottom. One is on a crest next to a large bubblegum coral, and the other is in a nearby valley. These will provide a 10-day record of the near-bottom currents at both a peak and a valley site. Lastly, we use a small current meter (held by the ROV's manipulator arm) to measure currents for a few minutes at the peak and valley sites we visit during each dive. Each night, when the ROV returns to the research vessel (R/V) Western Flyer, we download the data from this manipulator-held current meter.
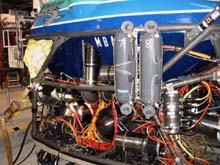
Niskin bottles Number 7 and Number 8 are ready and in the "open" position before the ROV is launched for the day. When the sub reaches a sample site, a signal is sent to the bottles and the top and bottom covers snap closed. Click image for larger view and image credit.
To collect water for the POC measurements, we use Niskin bottles. The 6-liter (about 2-gal) bottles are strapped to the ROV and left in the "open" position. During the dive, we trigger them to close and collect a water sample. Once the ROV returns to the surface, we filter the water samples onto individual filter papers, which will be analyzed later to determine how much POC (aka coral food!) is present at the different sites.
Toward the end of the cruise, we will release the current-meter moorings from the bottom, then haul them on board the R/V Western Flyer, download the data, and head for home. Back in our laboratory on shore, we will analyze our samples and data to see if they either support or refute our flow hypothesis for coral distributions.
Sign up for the Ocean Explorer E-mail Update List.