


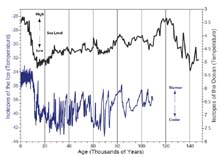
Figure 1. Two records of climate change over the last glacial cycle. The oxygen isotopes of the ocean reflect both sea level and temperature changes. The oxygen isotopes of Greenland ice reflect the temperature of precipitation above the core site. Click image for larger view and image credit.
Paleoclimate and Deep-Sea Corals
Jess Adkins
California Institute of Technology
When many of us think of 'climate change', we envision various catastrophic scenarios in our near future. From rising carbon dioxide levels in the atmosphere, changing vegetation growing patterns, to melting ice sheets and rising sea level, there is uncertainty about our climatic future over the coming years, decades and centuries. In paleoclimatology we use the fact that all of these things have happened in the past to better understand why and if they might happen in the future. One of the goals of this NOAA Ocean Exploration program is to use deep-sea corals to help unravel the climate shifts of the recent geologic past.
Climate on Different Timescales
What might seem like the distant past to some, can seem like recent history to others. The last 120,000 years of climate history contains a single glacial to interglacial cycle. 20,000 years ago the ice sheets that covered Canada and Northern Europe were at their maximum extent (the Last Glacial Maximum, or LGM). By ~8,000 years ago they were gone. The last time it was as warm and ice free as the last 8,000 years was ~120,000 years ago (Figure 1). All of these changes are paced by variations in the earth's orbit around the sun. Operating at 20, 40 and 100 thousand year periods, these Milankovitch cycles set the clock for glacial to interglacial climate change. These can seem like very long periods relative to our lifetimes, but they are relatively short compared to all of earth history. Of the ~4.5 billion years earth has been around, the last ~2.7 million years is only one of a small number of times the earth has been glaciated, or less than one-tenth of one percent of the time.
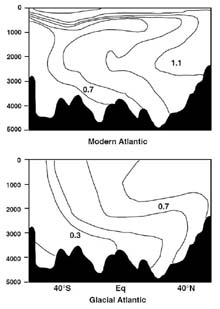
Figure 2. Deep ocean circulation patterns in the modern Atlantic and during the Last Glacial Maximum. For our purposes the most important difference between these two maps is the larger influence of Antarctic Bottom Water at the latitude of the New England Seamounts during the glacial period. Click image for larger view and image credit.
The imprint of these climate cycles on sea level, mean temperature, ice extent and ocean/atmosphere circulation is huge. Figure 1 shows that at the LGM sea level was ~120 meters lower than today. However, in the early 1990's we were treated to a paleoclimate surprise. Records from the Greenland ice sheet published in 1992 show that the earth's orbit is not the only story. In Figure 1 we compare the temperature changes recorded by the oxygen isotopes in the Greenland ice with the sea level and temperature record from deep-sea benthic foraminifera. While the Milankovitch cycles are clear in the marine record, there are many, many more climate shifts in the ice data. Because the ice core is a nearly perfect recorder of time (ocean sediments, on the other hand, are mixed by benthic organisms), we can see that large amplitude and rapid changes in the temperature over Greenland are a characteristic feature of the last ice age. However, the last ~10,000 years have been relatively warm and stable. Understanding this 'sub-Milankovitch' climate variability, and its absence in the Holocene, is a major thrust in modern paleoclimate research.
The Deep Ocean 's Place in Climate Change
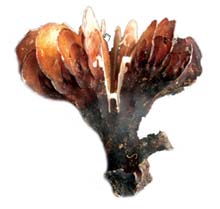
Figure 3. A fossil Desmophylum dianthus skeleton from the New England Seamounts. This sample is about 5cm tall and lived for ~50-100 years about 15,000 years ago. Click image for larger view and image credit.
The effects of glacial cycles are also seen in the deep ocean. Figure 2 shows the major deep-water masses of the modern and LGM Atlantic Ocean. Because denser water must always lie below less dense water, the ocean can be thought of as a 'stratified bathtub'. New deep waters can only punch through this stratification at special places in the high latitudes where seasonal cooling and salinification make surface waters that are denser than the water below. The water mass that forms around Greenland is called 'North Atlantic Deep Water' (NADW) and the water that forms around Antarctica is called 'Antarctic Bottom Water' (AABW). Today at the latitude of the New England Seamounts the whole water column is filled with NADW. At the LGM there is a large component of AABW below about ~2000 meters. As the deep ocean contains all of the mass, carbon and thermal inertia of the ocean-atmosphere system, changes in its circulation pattern can have profound effects on global climate.
This view of the past ocean was made from measuring the isotopic chemistry of calcium carbonate shells of benthic foraminifera that grew during the LGM. Deep-sea corals from the New England Seamounts can do the same thing, with several key advantages. The Uranium rich aragonite skeletons of Desmophyllum dianthus are ideal for measuring precise and accurate ages (Figure 3). In addition, each coral lives for about 100 years and precipitates a skeleton that can't be mixed up in time. Like the ice cores, these corals can record very rapid events in the circulation of the deep ocean. While foraminifera have been very good at recording the glacial-interglacial changes in deep ocean patterns, we need the corals to find the rapid changes, seen in the ice cores, in the deep sea.
Climate's Effect on Populations
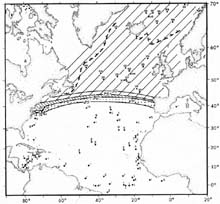
Figure 4. The North Atlantic Ocean distribution of the planktonic foraminifera N. pachyderma (sin) at the Last Glacial Maximum (LGM). Compared to the modern distribution (dashed line near Greenland ) this 'foram' found a much wider geographic range at the LGM. This data set shows that the polar front moved very far to the south and traveled more zonally across the LGM Atlantic. It is an excellent example of how marine populations can 'feel' climate change. Click image for larger view and image credit.
Another aspect of our paleoclimate research on this expedition involves the study of populations in space and time. One of the main results from the 1970's era Climate Mapping Project (CLIMAP) was the realization that marine populations 'feel' climate change in a diagnostic way. Figure 4 shows the results of counting the relative abundance of the planktonic foraminifera N. pachyderma (sin) in modern (dashed line near Iceland ) and LGM age (shaded area) sediments. It is clear that this cool water loving species greatly expanded its geographic range during the last glacial period. Cooler waters north of the polar front extended much further south at the LGM and were much more zonal. Clearly the surface plankton 'feel' climate change. We have preliminary evidence from our last cruise to the central New England Seamounts in 2003 that D. dianthus populations also feel climate changes in the deep ocean. Fossil skeletons of this species are much more likely to be from glacial periods than from interglacial ones. Within a glacial period they are also more likely to be from times of the 'cold mode' of rapid climate change than from the 'warm mode' (see Figure 1). By traversing the whole seamount chain on this expedition we hope to collect the material need to explore this intriguing distribution in both space and time.