


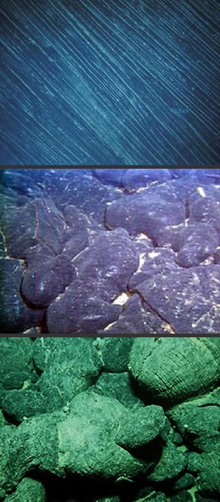
(Top to bottom) Sheet, lobate, and pillow lava morphology, the three main morphological flows that are produced by submarine eruptions. Along mid-ocean ridges, the different flow morphologies primarily reflect the rate at which the lava erupted. The presence of sheet flow morphology suggests a high rate of eruption, pillow flow morphology suggests a low rate of eruption, and lobate flow morphology indicates an intermediate eruption rate. Click image for larger view and image credit.
Studying Frozen Lava Flows
December 28, 2005
Jason Meyer
Graduate Student
University of South Carolina
The majority of the earth’s volcanoes occur at mid-ocean ridges on the ocean floor, yet there has never been a first hand observation of lava flowing from volcanic vents on the deep sea floor. This presents a challenge when attempting to understand mid-ocean ridge volcanoes.
To figure out what happens during deep sea eruptions, we study the “lava morphology” of the frozen lava flows. Lava morphology is the outward appearance of the cooled lava after an eruption. There are three main morphological flows that are produced by submarine eruptions, which include sheet, lobate, and pillow flows.
Along mid-ocean ridges, the different flow morphologies reflect changes in the volcanic plumbing system, mainly the rate at which the lava erupted. The presence of sheet flow morphology suggests a high rate of eruption, whereas pillow flow morphology suggests a low rate of eruption. Lobate flow morphology indicates an intermediate eruption rate.
Lava morphology distribution along the East Pacific Rise indicates that the magma chamber beneath the ridge is discontinuous, or “segmented.” Pillow flows are observed to predominate over sheet flows at segment ends and sheet flows are more abundant than pillow flows at segment centers
Previous methods of mapping these morphology distributions have relied largely upon camera-tow and submersible observations. However, these near-bottom observations are limited to small areas of the ridge due to time and visibility constraints. The inability to visually see the entire ridge may bias our idea of the lava morphology distribution. A solution to this problem is the use of a high-resolution side-scan sonar, such as the DSL-120 used in this cruise, for mapping of lava flow morphology over large regions of seafloor.
As a master’s degree student, I have been working on a method to identify and map lava morphology by integrating near-bottom visual observations with a much larger perspective of the seafloor via side-scan sonar imagery. Using techniques common to remote sensing or satellite imagery, the method involves relating ground reference data (for example, pillow flow locations identified from seafloor photos) with information provided by the remote sensor (ie. side-scan sonar images).
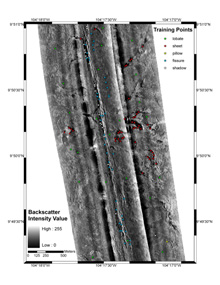
The chart above displays a section of sidescan sonar data with ground reference lava morphology classifications relating to different backscatter intensity values. Graduate student Jason Meyer is using data collected from the Medea camera sled and DSL-120 tow-sled to identify the distributions of seafloor morphology and structures along the Galapagos Spreading Center. He will take information about lava morphology, such as whether the dominant flows are lobate, sheet or pillow flows, and correlate it to backscatter intensity values collected by the side scan sonar on the DSL-120. Click image for larger view and image credit.
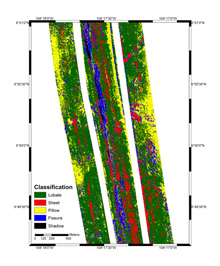
The chart above displays the same sidescan image that has been converted from processed sidescan data to be classified by lava morphology type, based on backscatter values correlating to particular types of lava morphology. Graduate student Jason Meyer is using data collected from the Medea camera sled and DSL-120 tow-sled on this cruise to identify the distributions of seafloor morphology and structures along the Galapagos Spreading Center. Click image for larger view and image credit.
Images provided by side-scan sonar are gray-scale (black to white) representations of the seafloor based on the acoustic backscatter of the seafloor (see December 14th Log). The variability of acoustic backscatter at mid-ocean ridges depends on the roughness and slope of the seafloor surface and the amount of sedimentation. In order to interpret sonar images one must take all of these factors into account. The method I use to classify lava morphology within a sonar image relies on identifying how these factors are unique to each flow type. For example, seafloor roughness can be correlated to distinct lava flow morphology. Multiple locations usually identified by submersible dives as being sheet flows should relate to a smooth roughness “signature” within the sonar image. By identifying the unique acoustic “signature” of each morphology it is possible to quantitatively interpret the sonar image quite accurately and efficiently.
In a similar manner, I will use the lava morphology data we are currently collecting on this cruise from the Medea camera-sled and correlate it to processed DSL-120 side-scan sonar data to identify the distributions of seafloor morphology and structures along the Galapagos Spreading Center.
GalAPAGoS: Where Ridge Meets Hotspot will be sending reports from Dec 3 - Jan 10. Please check back frequently for additional logs from this expedition.
Sign up for the Ocean Explorer E-mail Update List.