


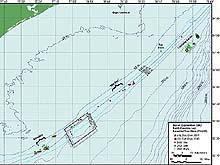
Cruise planning chart of research areas created with GIS and GPS application software. Different colored dots indicate potential sampling stations. Click image for a larger view.
Are We There Yet?
August 13, 2002
Jacquie Ott, GIS SpecialistNorth Carolina National Estuarine Research Reserve
![]() Watch a video of the beautiful and complex habitat of the Lophelia coral banks. (mp4, 1.4 MB)
Watch a video of the beautiful and complex habitat of the Lophelia coral banks. (mp4, 1.4 MB)
There was just a sliver of moon, so the stars were especially bright over the ocean last night. It made one appreciate how early seafarers relied on celestial navigation skills to guide their explorations and lead them safely back home. Today, scientists on the Islands in the Stream 2002 expedition are using technology-based tools to map and navigate to their ocean research sites. On board the R/V Seward Johnson, we are using a combination of global positioning system (GPS) and geographic information system (GIS) techniques.
A GPS unit uses signals from several satellites to calculate precise positions on the Earth. A location is described by a unique pair of numbers, called geographic coordinates. This is similar to an address at the intersection of two roads. The coordinate pairs consist of a value for latitude and longitude that identify the distance north or south of the equator, and east or west of the Prime Meridian in Greenwich, England. GIS is essentially a method for creating computerized maps, based on geographic coordinates. Maps can be created from different types of spatial information, such as water depth. Each set of data is converted to a digital file that includes geographic coordinates for every location.
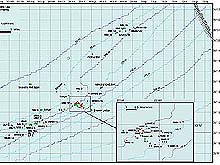
Detailed chart of the “Steeples” research site highlighting the area's bathymetry and potential dive sites Click image for a larger view.
Both GPS and GIS are essential in planning and conducting the North Carolina leg of Islands in the Stream 2002 expedition. Initially, GIS was used to develop bathymetric (water depth) charts of the expedition area. One chart provides an overview of the entire area, from Cape Lookout to Cape Fear, North Carolina. Prior to the cruise, principal investigators used this chart to identify four smaller research areas—the Steeples, Snowy Wreck Proposed Marine Protected Area, “Mid Bay” and Lophelia Banks. These areas were selected based on water depth, bathymetry (underwater topography), location and type of data previously collected, and knowledge of the fish communities of interest. Larger charts, with greater detail, were prepared for each research area and marked with potential sampling sites for the current expedition.
For this leg of the Islands in the Stream 2002 expedition, a complete desktop computer was brought onboard the R/V Seward Johnson and set up in the ship’s dry lab. A variety of navigation information is continuously recorded and displayed on the computer's monitor. This data is received directly from the ship’s navigational system; it includes the vessel's location, speed and heading, as well as water depth. As water depth soundings are collected, they are displayed on top of the existing bathymetric charts using the GIS software on the computer. Additional information is provided from the Johnson-Sea-Link II submersible. During each research dive, the submersible’s exact location and depth is carefully tracked at a monitoring station on the Seward Johnson’s bridge. Following the dive, this data is plotted on our existing digital charts. All of this information is used by researchers on the cruise to determine in real-time the specific location and duration of each sampling effort, and how to most efficiently plan for the next station or weather contingencies.
Relatively few differences exist between using the GIS on land or onboard the ship. However, to conduct a two-week expedition at sea, everything that is required for a routine day at work must be taken along, such as computer disks, printers, backup software, cables and more. Even more importantly, all of the equipment must be well tied down. We experienced the need for this first-hand when tropical storm Cristobal provided us with 6- to 12-foot seas for several days. Conducting these operations requires a great deal of planning and preparation. However, one very special reward is to take a break from the computer and find the expanse of the deep blue sea right outside the office door.
These specially designed traps isolate the shrimps and crabs inside from light and elevated water temperatures as they are brought to the surface. Click image for larger view.
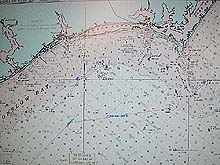
Computer monitor display in the ship's dry lab showing the ship's position and track in real time. The image is updated with data supplied from the ship's navigation log. Click image for a larger view.
Sign up for the Ocean Explorer E-mail Update List.