


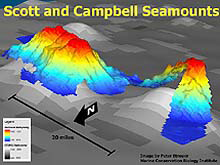
High resolution Seabeam bathymetry (in color) derived from the Atlantis shipboard echosounder is overlayed upon lower resolution ETOPO2 satellite derived bathymetry. Multibeam swath mapping is state of the art technology, but this information is only available for those few areas of the world's oceans where surveys have been conducted. It took the crew of the R/V Atlantis two nights to survey Scott and Campbell Seamounts in the Gulf of Alaska. Click image for larger view.
Measuring Mountains in the Sea
July 8, 2002
Peter Etnoyer, Staff Scientist
Marine Conservation Biology Institute
![]() Take a virtual flight through the Gulf of Alaska submerged seamounts. (mp4, 2.4 MB)
Take a virtual flight through the Gulf of Alaska submerged seamounts. (mp4, 2.4 MB)
![]() Take a virtual flight through the Patton seamount. (mp4, 2.9 MB)
Take a virtual flight through the Patton seamount. (mp4, 2.9 MB)
We can determine seafloor topography or “bathymetry” in a number of different ways that fall into two basic categories: direct measurement and indirect measurement. Direct measurement techniques use marked, weighted lines that are dropped from the side of the boat. When they hit bottom, the researcher marks the line at sea level and records the depth measurement. Another direct measurement option is to send a diver, submersible vessel, or remotely operated vehicle (ROV) to the seafloor using a pressure gauge to record the weight of the water overhead. An equation can then translate this pressure into depth.
Indirect measurements of bathymetry are recorded by ship-mounted acoustic echosounders that bounce a signal off the seafloor and record the amount of time it takes for that signal to “bounce back” to the ship. Another form of indirect measurement is that which is measured by orbital satellite instruments that record gravity and sea surface height and translate this information into bottom depth. This image illustrates both of these methods.
The R/V Atlantis is equipped with a Seabeam 2100 multibeam survey system consisting of 120 echosounders configured into an array. The multibeam system sends a sonar signal “ping” from projectors mounted on the keel of the ship. This signal then travels to the seafloor where it is reflected off the bottom. Underwater microphones called “hydrophones” mounted across the bottom of the ship listen for the reflection of this signal and convert the sounds to electrical impulses and send these impulses to the processor. Bottom depth is determined based on the amount of time it takes to receive the signals as well as signal intensity. Fully processed data consists of a xyz file of longitude, latitude, and bottom depth at 275 meter intervals.
Multibeam swath mapping is state of the art technology, but this information is only available for those few areas of the world where surveys have been conducted. The National Geophysical Data Center's Earth Topography is a type of topographic data that is available for nearly the entire globe. This data has a 2 minute resolution (ETOPO2) in which depth values are averaged at 2 minute intervals (2/60 * 111km/degree = ~4km). This earth topography data is derived from satellite measurements of gravity (large underwater masses will exhibit higher gravity signals) combined with sea surface height calculations, and referenced to traditional leadline measurements and older surveys. Contrary to popular belief, the ocean is not flat. Satellite altimeters can measure variations in height within centimeters, and use this information to detect subsurface masses, warm core, and cold core eddies in the ocean. All this information is combined to produce valuable bathymetry estimates in a 4km grid for the world's oceans.
Our research on this cruise has shown that satellite derived bathymetry data is a valuable tool for planning surveys and identifying seamounts, but the degree of relief offered by multibeam surveys also provides important information for habitat level research. ETOPO2 satellite data fails to resolve any feature smaller than 4km, while mutlibeam can distinguish geological features like lava flows, canyons, and outcrops larger than 275 meters. However, ETOPO2 data is inexpensive and easily accessible, while multibeam data is extremely expensive to collect in that it requires a ship and a crew, as well as sophisticated software.
Applications of high resolution bathymetry data
One of the purposes of this expedition for the Marine Conservation Biology Institute is to groundtruth ETOPO2 satellite data with multibeam data in order to determine the level of accuracy for that global relief product. The Baja California Sur to Bering Sea (B2B) Marine Conservation Initiative, a project of the Commission for Environmental Cooperation (CEC) will use this data to identify areas of high topographical complexity and high biodiversity. The CEC is a tri-national initiative mandated by a rider to the North American Free Trade Agreement (NAFTA). Seamounts are particularly important to this conservation initiative because they harbor deep sea coral beds, a rare and poorly studied ecosystem that provides refuge to deep sea fish, crabs, and shrimp. Bottom trawling poses a devastating threat to these "redwoods of the sea", and in order to protect these fragile ecosystems, we first have to know where they are.
While ETOPO2 can tell us where to find a seamount, We need multibeam data to plot the Alvin submersible transect over a zone where we expect to find the high biodiversity associated with Red Tree Corals and Bamboo Corals. The viewing range of the Alvin is approximately 15-30 meters and power is limited, so the pilot has to know where he is going before he dives. The science team uses each of these methods to guide those decisions. Some of the best coral collections on this cruise came from shallow pits in the seamount and distinctive 'shallow' shelf features. Without all these methods of data collection, we never could have found them!
Sign up for the Ocean Explorer E-mail Update List.