
By Keeley Belva - NOAA's Office of Ocean Exploration and Research
August 19, 2010
So, what happens to all of this data that we are collecting on the ATLAS?

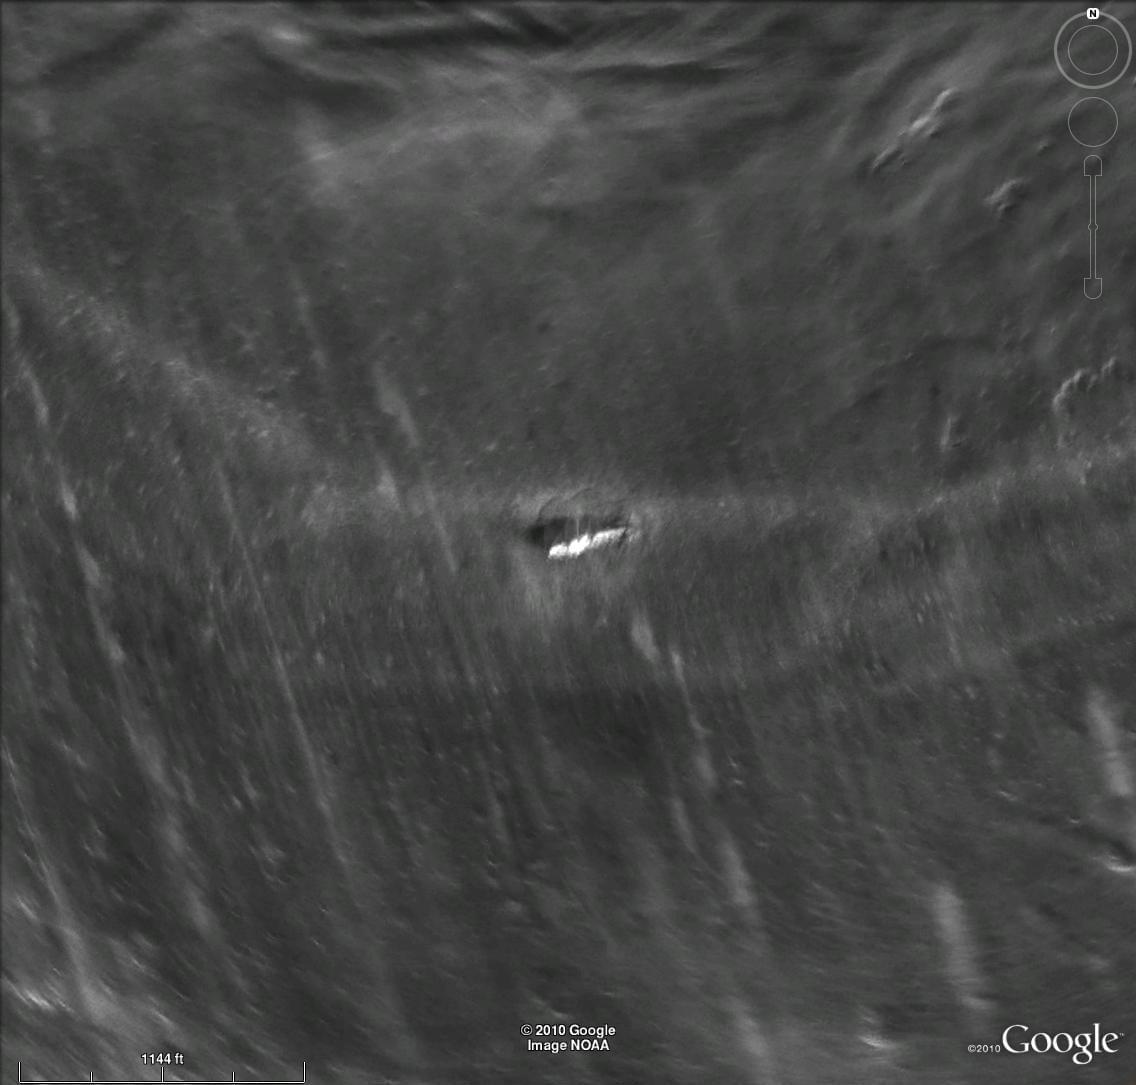
This image shows the shipwreck W. H. Gilbert as imaged from the ATLAS. The lighter area is closer to the AUV. Image courtesy of Thunder Bay 2010 Expedition, NOAA-OER. This image is in the public domain. Download larger version (jpg, 102 KB).
After the AUV is retrieved from the water, the team begins downloading the data. This takes about half as long to download that it does to collect. For example, on Tuesday we collected about 11 hours of data and it took five and a half hours to download! Luckily this can happen overnight, once the team gets it started.
Usually the next day, while some of the team goes back out on the research vessel, Mark Story begins processing and refining the data to incorporate it into products that are more user-friendly, like maps and images.

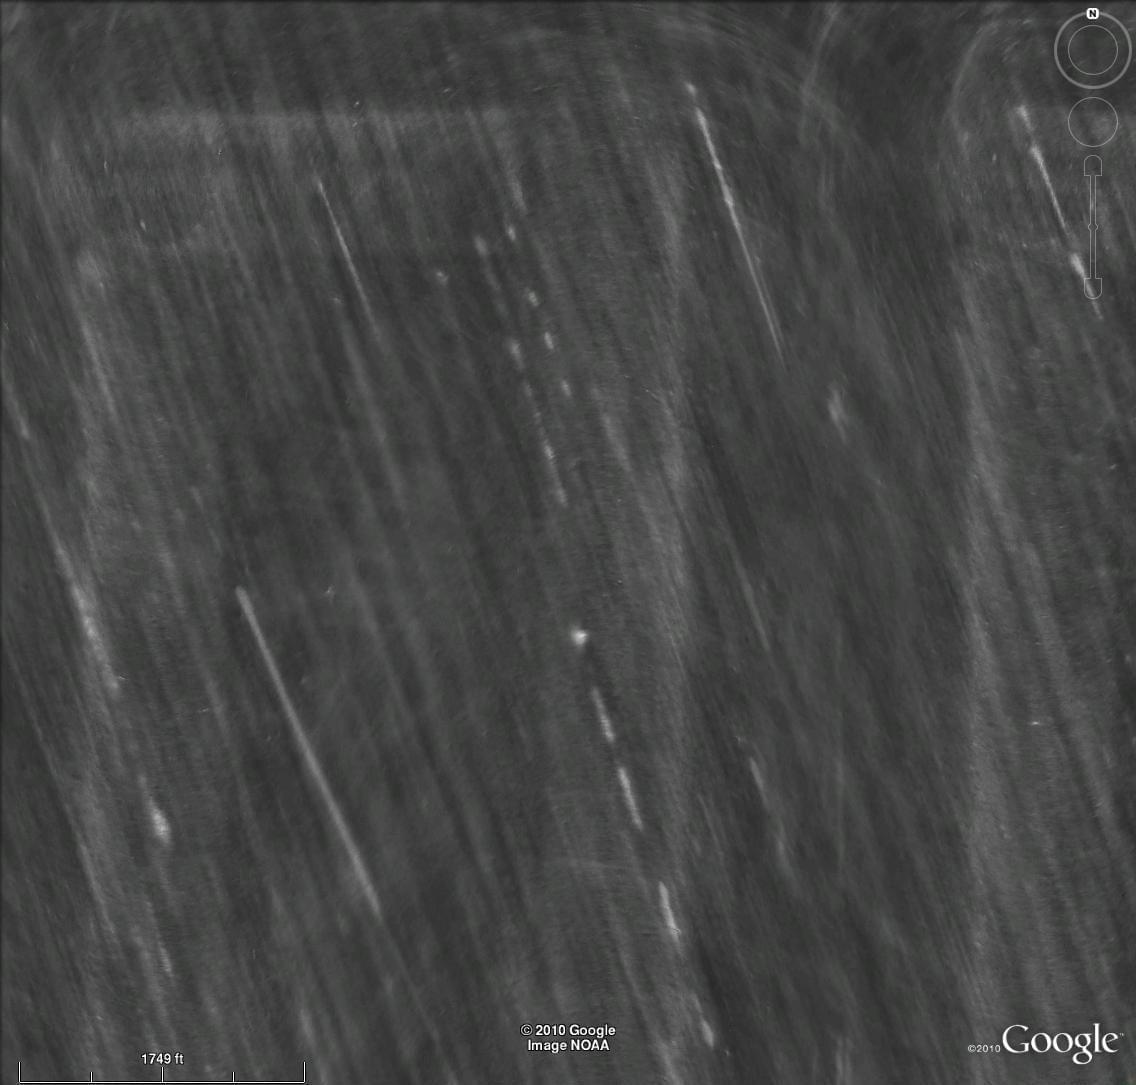
Scientists are still not sure what to make of this image, but it’s shown up fairly consistently in the data so far. Image courtesy of Thunder Bay 2010 Expedition, NOAA-OER. This image is in the public domain. Download larger version (jpg, 106 KB).
Looking at some of the images is really interesting—some you get a feeling of what you’re looking at right away. For instance the team imaged one of the wrecks that is just outside of the Sanctuary boundaries—the W/H Gilbert. In the image you get a good sense of what the ATLAS is doing.
Mark explained to me that it was similar to shining a flashlight on an object in the dark. The side closest to the ATLAS is shown in white because it had the strongest response, while the shadowed area behind it had a weaker response.

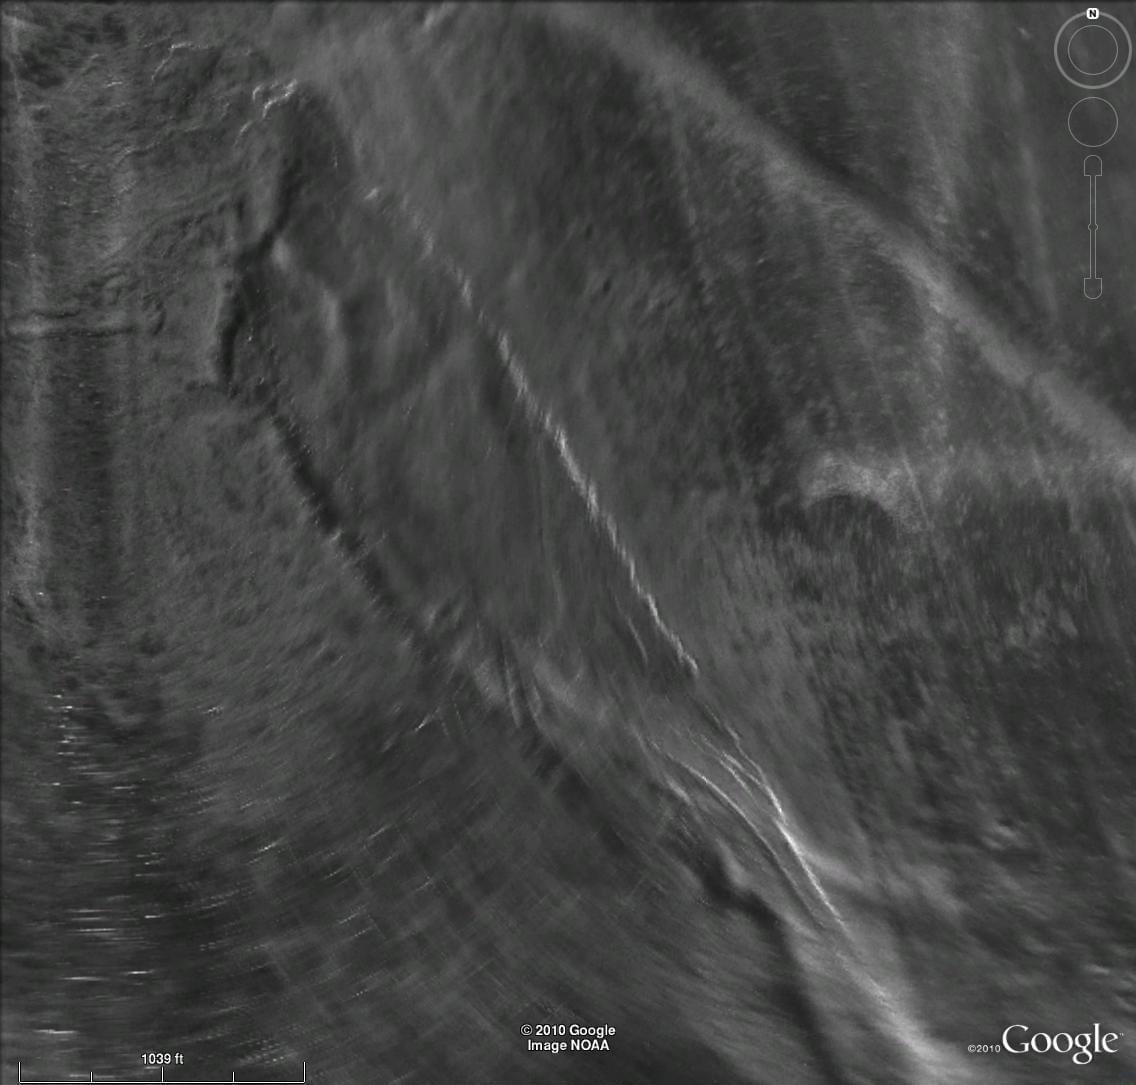
Here the ATLAS picked up a change in bottom depth, and you can see a geological feature that is similar to a plateau. Image courtesy of Thunder Bay 2010 Expedition, NOAA-OER. This image is in the public domain. Download larger version (jpg, 120 KB).
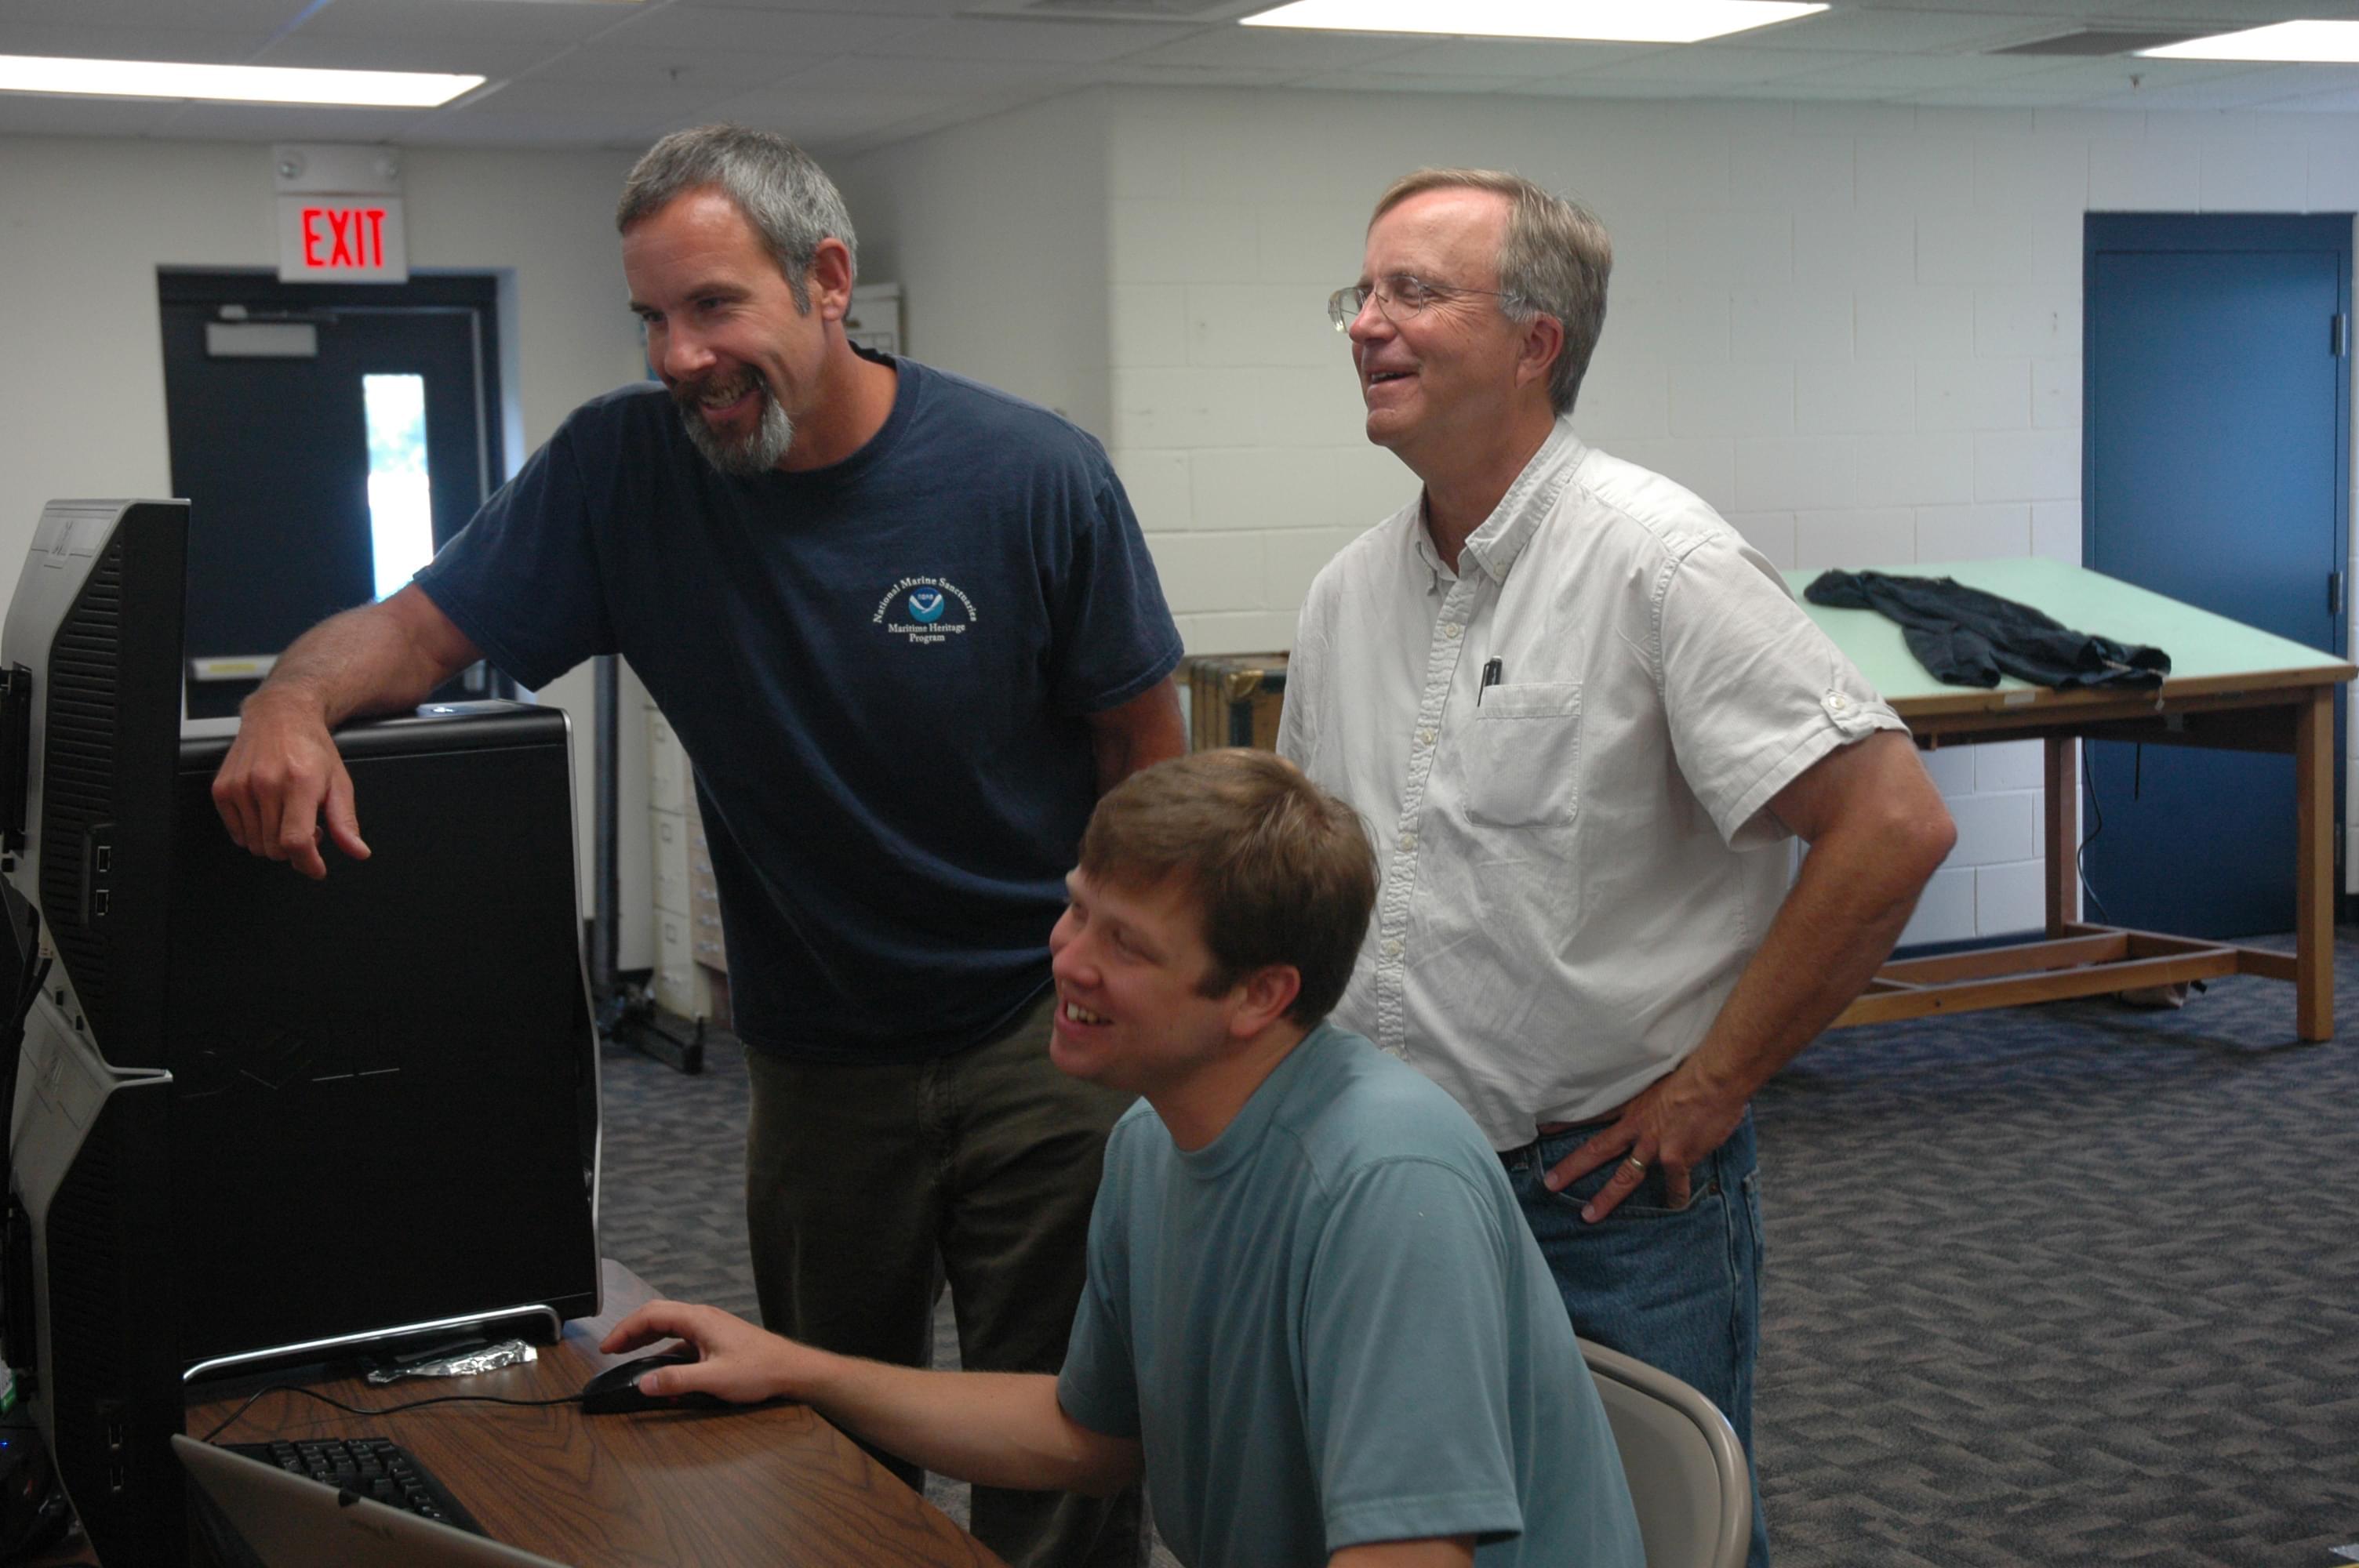
, shown with Russ Green (left) and Charlie Loeffler, has spent the last few days at his computer learning more about the Lake Huron region and refining the data collected by ATLAS.")
Mark Story (front), shown with Russ Green (left) and Charlie Loeffler, has spent the last few days at his computer learning more about the Lake Huron region and refining the data collected by ATLAS. Image courtesy of Thunder Bay 2010 Expedition, NOAA-OER. Download larger version (jpg, 408 KB).
Other images lead to more questions. Some of the survey area images are coming back with long stripes, or what we’ve been calling brush-strokes. We’re not sure yet what this means. Could it be from glaciers that were once here? Or is it from ships that were dragging something behind them? Or…aliens? Well, maybe not.
What ever they show, these images allow the team revise the survey strategy or shift gears quickly to prioritize, which areas might be “ground truthed” or looked at more extensively with shorter-range, higher-resolution side-scan sonars, SCUBA divers, or other experts.


