


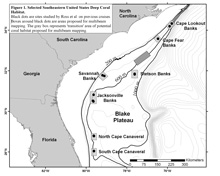
Figure 1. Map generated using ArcMap software giving an overview of the 2004 expedition cruise plan. All information on the map, aside from the text, is georeferenced and spatially accurate. Click image for larger view and image credit.
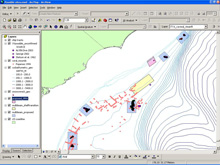
Figure 2. Screen capture of an ArcMap scene containing several layers of data. The left side of the image is a list of the data files included in the map. Check marks indicate that the layers are active (visible). Any data containing spatial information (latitude and longitude) can be displayed in such a scene. Data layers can be turned on or off as needed. Click image for larger view and image credit.
Collaborative Mapping: the role of GIS in modern research
October 19, 2005
Melissa L. Partyka
Ecologist, GIS-Specialist
Center for Marine Science, University of North Carolina – Wilmington
Research Technician
![]() Animated flyover of a Cape Lookout deep coral study site with data from several previous submersible tracks.
Animated flyover of a Cape Lookout deep coral study site with data from several previous submersible tracks.
(Quicktime, 2.2 Mb.)
The Life on the Edge 2005 team is working on seafloor mapping today. Here is an essay on the technology and techniques that they will be employing.
Seafloor Mapping: Not just for geologists anymore….
In this day and age, where anyone with a little Internet savvy has access to global positioning software and satellite imagery, it is fast becoming obvious that the construction of relatively accurate maps is no longer restricted to experienced geologists and cartographers. With an ever increasing coastal population and the related increase in the use of coastal waters, many mariners are interested in mapping local bathymetric features, whether for navigation (shoals, reefs, passes) or simply for recreation (fishing holes, wrecks, dive sites). Just as the interest in deep-sea habitats has increased for scientists, resource managers and agencies over the last decade, the general public’s desire to know ‘what’s down there’ is rapidly growing as well. One of the main purposes of Life on the Edge 2005 is to determine exactly that, what is down there. More specifically, we will locate and map deep-sea habitats and research the relationships of various animals to these habitats, and we will continue to gather data on the features of the seafloor of the southeastern US.
Challenges of seafloor mapping
Though large volumes of data are available on many seafloor features, there is still only limited information available on a detailed, small-scale, especially in deep waters. Quite often our open ocean navigation charts still rely on data gathered by hand lines hundreds of years ago. And from a practical economic view, no one really cared what the bottom looked like as long as it was deep enough for shipping. The advent of single-beam sonar did much to improve the resolution of bathymetric data, but the fact remains that these data are not of survey quality and often result in a misleading view of bottom topography. Multibeam mapping, including analysis of backscatter, is a highly effective means of identifying potential reef habitats, however in situ ground truthing remains essential to accurate classification of these habitats. It is our hope to eventually use this technology to map our deep-sea coral study sites.
While aboard the Seward Johnson we will conduct multiple submersible dives to the seafloor where physical, chemical, biological and spatial data will be collected. Onboard software allows us to accurately track the submersible, collecting information on latitude, longitude and depth. With this information we can produce three-dimensional maps of the seafloor while tying a huge amount of data (including continuous video recordings) to these coordinates. Many of these data can be continuously uploaded and converted into mapping files while still at sea. In this way we will be able to see the data in real time and real space, allowing us to check for errors or to give closer focus to areas of particular interest.
Even with the use of submersibles, gathering data on a fine-scale in areas that have not been thoroughly explored continues to be extremely challenging. Just getting to these sites is often difficult and expensive. It is for these reasons that interagency collaboration is so essential to the success of projects such as this. Data we collect are also contributing to other efforts whose goals are deep sea bottom habitat classification. For example, we are involved with The Southeast Area Monitoring and Assessment Program (SEAMAP) and Southeast Deep Sea Coral Initiative (SEADESC), both of which are using existing data to document continental slope bottom types in the area. We are beginning to make progress on the enormous task of detailed characterization of complex bottom habitats.
Why habitat mapping matters
So why do we bother with all of the time, money, and manpower that are required to map these seemingly isolated areas of the deep ocean? To begin with, though deep-sea corals such as Lophelia are widespread, very little is known about the conditions necessary for their recruitment and development into reefs. What is known is that they take a very long time to form, and are highly susceptible to destruction. These reefs have been shown to support a diverse and distinctive assortment of fishes and invertebrates, animals that may be without adequate habitat should the reefs decline. The increasing use of the deep sea for mining, disposal activities and fishing makes the need for accurate habitat mapping that much more relevant and imperative. No Lophelia reefs are currently protected in the US EEZ, however several large areas have been proposed as Habitat Areas of Particular Concern. Accurate information on locations and sizes of reefs, as well as data on the associated fauna, are necessary to better manage these areas. The use of Geographic Information Systems (GIS) provides the best platform to integrate large data sets into geographically meaningful, immediately useful products.
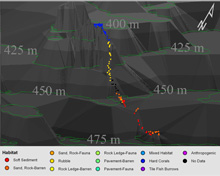
Figure 3. Example of a three-dimensional depiction of changes in habitat over the course of a single submersible dive track. As we gather more detailed bottom contour data, our maps will show increasing details. This, matched with the first hand view provided by the submersible, is a powerful way to describe the sea floor. Click image for larger view and image credit.
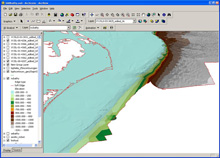
Figure 4. Screen capture of the 3-D mapping program, ArcScene. In this program bathymetric data can be turned into realistic surfaces over which information collected during the dives (or other sample collections) can be projected, rotated, queried and interpreted. Displayed here is the continental shelf break off of Cape Hatteras. Click image for larger view and image credit.
To GIS or not to GIS
Though GIS software allows for the production of high-quality static map images, such as those displayed here, the software does far more than make pretty maps. The real advantage of creating a GIS is the capacity to query datasets and project this information on to a georeferenced surface. The ability to query the data in real space means that we can look at the relationships between habitats and their associated communities as they actually occur. For example, we can determine how species organize themselves in space; such as randomly, evenly, or clumped. It can also help us understand how habitats, such as deep-sea coral mounds, are dispersed with regards to seafloor features, depths and/or physiochemical properties of the oceans. Further software extensions allow us to view data in three dimensions, letting us examine the data from numerous angles. We can also animate these scenes so that we can virtually ‘fly’ over the data onscreen, thus giving us a virtual tour of the terrain, habitats and fauna we have mapped. Without an accurate understanding of habitat distribution, including its spatial and temporal variability, it is difficult to assess habitat function and trends in habitat quality and productivity. What makes using GIS more exciting and valuable than working with a simple dataset is that we can do this all visually, in real space, while producing unique maps for a variety of users.
Bringing it all togetherThe final step in any GIS project is providing information to other researchers, government agencies or the public. Further exploration and mapping of the ocean floor will undoubtedly reveal many other unique habitats that require additional attention. Collaborative efforts, such as this expedition, bring information stored in the depths to light, and mapping plays a significant role here.
Life on the Edge will be sending daily reports from Oct 16 - Nov 4. Please check back frequently for additional logs from this expedition.