By Abigail Casavant
Jonathan Cotugno
Kate von Krusenstiern
Michael Barber
Explorers-in-Training
June 2, 2015
Only five percent of the world’s oceans have been mapped. NOAA Ship Okeanos Explorer is actively participating in exploratory mapping expeditions to increase our understanding of the seafloor. But how long would it take Okeanos to map the remaining 95 percent? If funds were unlimited, what would a campaign to map the oceans look like? These are the questions we were asked to answer as part of a multi-week project during our residency as Explorers-in-Training.

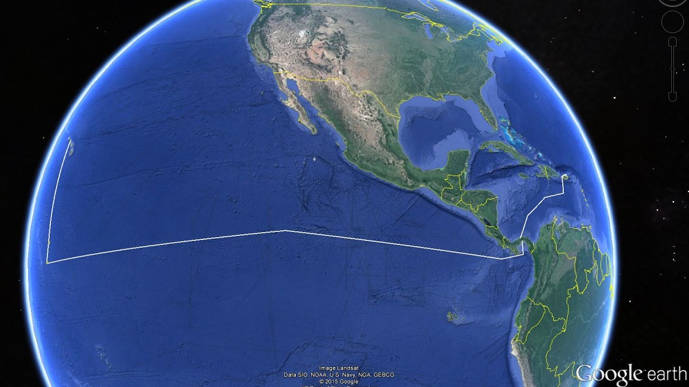
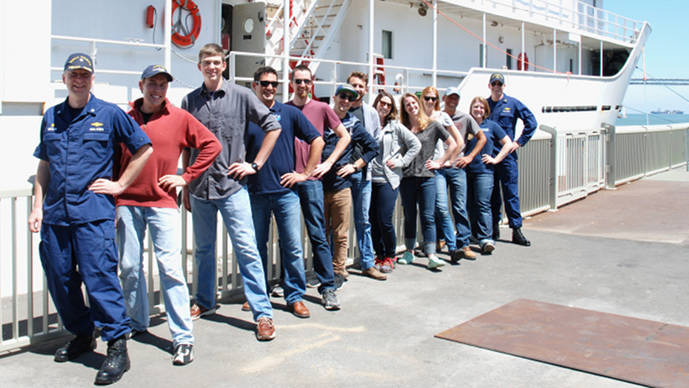
We set a timeframe to map the ocean in ten years and calculated how many ships would be needed. Each vessel would map a specific geographic area. This method allows us to optimize time and technology. For example, wide angle sonars would be dedicated to mapping shallower areas, and Automated Underwater Vehicles to map under ice-caps in polar areas. Image courtesy of the NOAA Office of Ocean Exploration and Research, Tropical Exploration 2015. Download larger version (jpg, 731 KB).
This project is divided into two parts. Part one asks how long it would take Okeanos to map the world’s oceans. Funds are not an issue when answering this question, but the current technology on board must be used. The second part of the project is to design a campaign to map the seafloor, also assuming unlimited funding.

This calculation takes into account the number of operational sea days for the vessel per year (190 days), the assumption that water shallower than 200 meters has already been mapped, a speed of 8 knots, and use of a predetermined EM302 swath angle table. All calculations were made using MatLab. Image courtesy of the NOAA Office of Ocean Exploration and Research, Tropical Exploration 2015. Download larger version (jpg, 484 KB).

This image from the National Centers for Environmental Information depicts 15.7 million nautical miles of survey lines received from international sources. Track lines have been enlarged for visibility. Note blank areas on the map include the Arctic and Antarctica regions. These areas have been poorly mapped, and are part of our areas of interest in the campaign. Image courtesy of NCEI. Download larger version (jpg, 238 KB).
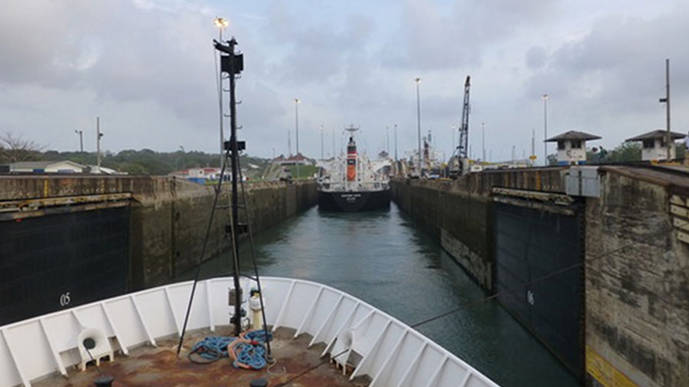
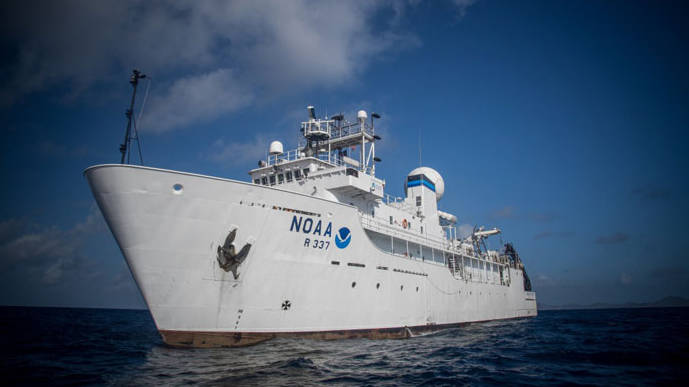
NOAA Ship Okeanos Explorer, America’s Ship for Exploration, is the only federal ship dedicated to ocean exploration. On board, the ship currently uses three types of sonars: the Kongsberg EM302 multibeam system, the Simrad EK60 single-beam system, and the Knudsun 3260 Chirp sub-bottom profiling system.
Because of the nature of the question of this project, only the multibeam system is considered in the calculations as the multibeam system can collect seafloor bathymetric data much more efficiently than the single-beam system. In this regard, the data collected from both the sub-bottom profiler and the single-beam are auxiliary to the bathymetric data collected from the EM302, and will not be used in determining how long it would take Okeanos to map the seafloor.
To begin, we first aggregated data and information regarding seafloor mapping operation on Okeanos including speed of the ship during mapping, the swath and depth specifications of the Kongsberg EM302, and the number of operational sea days per year. The ship currently operates 190 sea days per year.
Our calculation used a speed estimation of 4 meters per second, or approximately 8 knots. 8.5 knots is the ideal mapping speed utilized to achieve high quality data on the Okeanos using the EM302, but turns take time so we decided to use 8 knots for the calculation. Seafloor depth approximations were extracted from ETOPO2V2, a National Centers for Environmental Information (NCEI) database of seafloor and land elevations plotted to a two-minute latitude/longitude grid. ETOPO2V2 represents elevations averaged over each two-minute cell’s area. The seafloor elevation data was acquired using satellite altimetry technology combined with ground-truthed survey data.
With these depth approximations, seafloor areas were then segmented into depth ranges according to the depth modes of the EM302. MatLab, a statistics and plotting analysis software, was used to write a script that added our segmented areas of the ocean together to calculate how many years it would take to map the ocean floor.
As a team, we made the assumption that shallower coastal waters of 100 meters or less have already been mapped for navigation purposes, thus we excluded these depths from our calculations. These depths represent most of the five percent that has already been mapped.
Our answer? 1,042 years. Using the current technology aboard Okeanos Explorer, it would take 1,042 years to map the ocean floor.

We set a timeframe to map the ocean in ten years and calculated how many ships would be needed. Each vessel would map a specific geographic area. This method allows us to optimize time and technology. For example, wide angle sonars would be dedicated to mapping shallower areas and Automated Underwater Vehicles to mapping under ice-caps in polar areas. Image courtesy of the NOAA Office of Ocean Exploration and Research, Tropical Exploration 2015.. Download larger version (jpg, 487 KB).
Taking a millennium to map the bottom of the ocean using one vessel is unrealistic, so we set out to do what Okeanos could do in a hundredth of that time, or 10 years. In our campaign, we account for the types of sonars that will be used, priority areas for mapping, and challenges likely to be faced.
Using the estimate above, our team calculated that in 10 years we would need 104 ocean going vessels dedicated to seafloor mapping. Each vessel would be equipped with three systems:
The purpose of using these three systems is so that each vessel has the flexibility and means to map anything encountered. This method allows us to optimize time and technology. For example, wide angle sonars (Kongsberg 3200 EM) are more efficient in shallower waters.

In designing our campaign, we have four areas of interest, or priorities for mapping: polar regions, plate boundaries, sites with potential energy and economic interests, sites of archaeological interest. Image courtesy of the NOAA Office of Ocean Exploration and Research, Tropical Exploration 2015. Download larger version (jpg, 142 KB).
In designing our campaign, we have four areas of interest, or priorities for mapping. These include:
As evident during this expedition, there are multiple challenges to expect and overcome during any ocean-going campaign. The inability to collect data during poor weather is a major factor. In poor weather, the pitching of the ship can cause air bubbles to sweep down under the hull and sonar transducers. These air bubbles cause acoustic scattering and often render the sonar depth data useless. Weather is somewhat unpredictable, and this loss of productive time must be accounted for.
An additional challenge is unscheduled maintenance of the ship. Our numbers accommodate scheduled and regular maintenance of the ship by only being at sea 190 days per year. However, unexpected malfunctions can force vessels to return to port, with the potential for significant downtime.
A more predictable challenge is data management. In our MatLab calculations, we concluded that using technology aboard the Okeanos Explorer to map the world ocean would generate at least 2.67 x 10⁶ terrabytes of data (267,000,000 TB). This estimate is likely lower than what would actually be produced, because it does not account for the auxiliary data from multibeam sonars.
Our solution to managing this data is to have larger shipboard servers. We would use large RAID drives to send data to the national archives at the completion of each cruise of the campaign, where data would be stored and made publicly available as soon as possible.
Mapping the ocean seafloor is no easy task, and many logistics must be taken into account. Our numbers offer an estimate of how long the procedure would take, and a small glimpse into the logistics of planning a campaign to map the world’s oceans.
Download the poster we created as a visual representation of our campaign.