

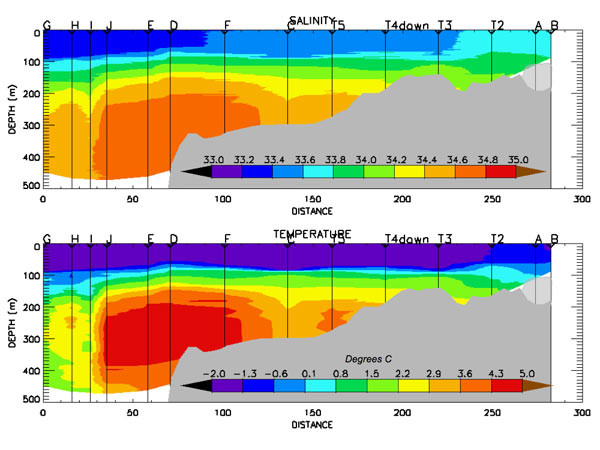
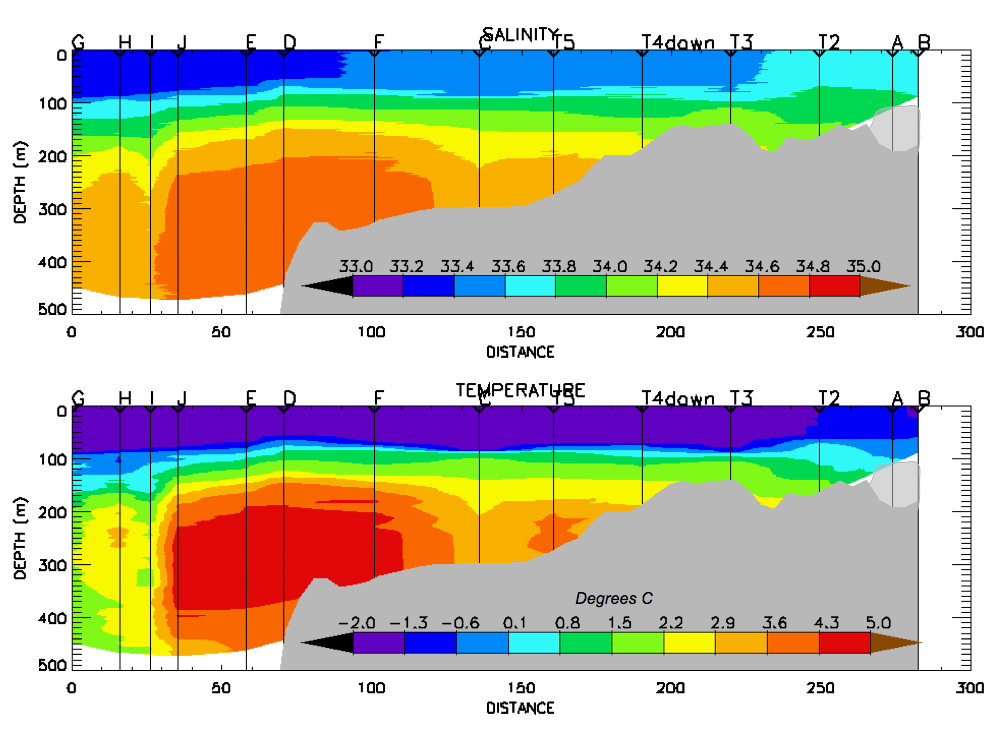
Interpolated oceanographic section across Baffin Bay (West to East = Left to Right). The upper panel shows the salinity and the lower the temperature. Image courtesy of Wendy Ermold.
Related Links
Tracking Narwhals in Greenland: Leg 2 Mission Summary