

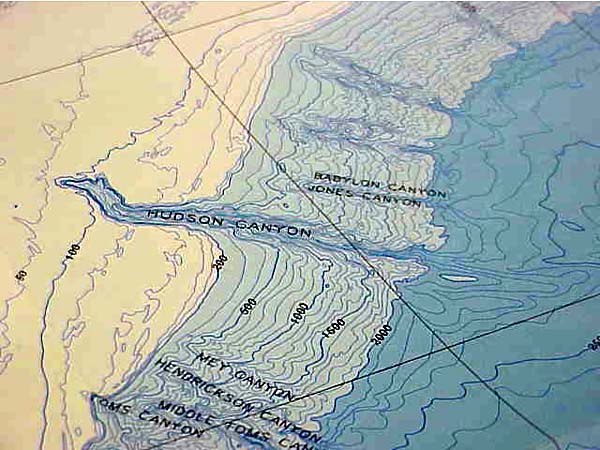
A contour line map of the Hudson Canyon region. This map was produced in 1988 (Escowitz, Hill & Bowen) and was based on echo sounding techniques. Each one of these contour lines represents a difference in depth between the lines before and after. Where the canyon is the steepest, the contour lines are the closest, due to rapid changes in depth differences. Image courtesy of Hudson Canyon Cruise 2002, NOAA/OER.