

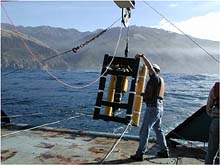
A Northrup-Grumman SM-2000 monochrome laser line scan integrated with a McCartney Underwater Technology FOCUS tow body, owned and operated by Science Applications International Corporation (SAIC). Click image for larger view.
Project Summary
Laser Line Scan Mapping for Seafloor Habitats
November 2001
Research sponsored by:
West Coast & Polar Regions Undersea Research Center (NURP)
Office of Ocean Exploration
Traditionally, population estimates of fished species have been based on the fishermen’s catch and on data from trawl surveys conducted by government agencies. In other words, the customary method of assessing fish populations has been to go fishing for them. Trawl surveys have several disadvantages. They do not representatively sample all species and habitats, and may even contribute to the depletion of some species.
As the populations of many fished species have declined, the need for better information about population status and distribution has become increasingly critical. With the reauthorization of the Magnuson-Stevens Fishery Conservation and Management Act in 1996, NOAA was given a clear mandate to identify and characterize essential fish habitats, and to include habitat management in fisheries programs. For many species, this means studying the range of habitats and ecosystems on the seafloor.
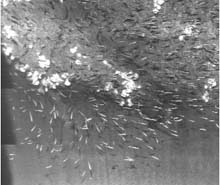
Laser line scan image of a large group of fish congregating around an isolated rock outcrop. The investigators speculate that these fishes are young widow rockfish and bocaccio, based on their ROV observations in the vicinity. Click image for larger view.
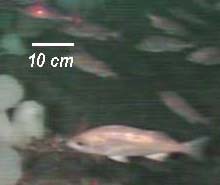
An image of widow rockfishes and bocaccio as seen from a ROV, which is used as a verification tool. Click image for larger view.
Groundfish assemblages, those fish and macroinvertebrate species associated with the seafloor, may be particularly well suited to habitat-based resource management. They are among the most diverse and economically valuable fishery resources on the U.S. West Coast. A number of rockfish species have declined dramatically over the past three decades, to the point where 6 species are currently listed as overfished by the Pacific Marine Fisheries Council, with at least one, boccacio, estimated to be at 2-3% of its population size in the 1970s. In general, rockfishes prefer rough, rocky seafloor with abundant places to shelter and hide, and trawling in such areas is not an ideal strategy. However, because of the strong association between rockfish species and specific seafloor habitats, the distribution of habitats provides a rational framework for studying and managing this diverse group.
Seafloor habitat research within NOAA typically has concentrated on estuarine and relatively shallow marine waters. Part of the reason this has not been extended to deeper areas is the fundamental difficulty and expense of making detailed, deep-water observations over an area large enough to be relevant to the dynamics of fish populations. Below SCUBA depth (i.e., > 30 meters), visual observations must be made either from human-occupied submersibles or from cameras on a remotely operated vehicle (ROV). This approach can be time-consuming and expensive, and usually is limited to “representative” small areas. Acoustic surveys by sidescan or multibeam sonar can cover much broader areas and are useful in a number of fishery habitat applications, but they have much lower resolution than direct observations. They can define the distribution of different types of seafloor, i.e., mud, smooth sand, rippled sand, rock outcrops, canyons, etc., but they cannot show the relationship of fish and invertebrates to these habitats. Also, interpretations of the acoustic images must be checked by visual observations, usually from a submersible or ROV.
The challenge is to find a more efficient technique -- one that provides high-resolution information on both the variety of seafloor habitats and the associated marine life, and can cover a large enough area to be statistically useful.
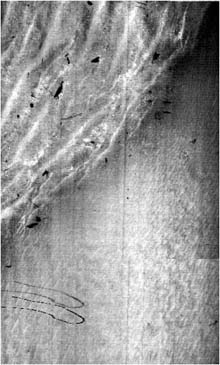
Laser image of a sharp boundary between sand waves (top left corner) and smooth seafloor. Dark objects in the area of sand waves are pieces of drift kelp. Salp chains (lower left) were relatively common in laser survey (mirror image is salp shadow -- objects above the seafloor are seen as double images). Click image for larger view.
Laser line scan (LLS), an electro-optic imaging technique, may be able to bridge the gap. It provides the efficiency and spatial coverage of a remote survey system, at an image resolution approaching that of visual observations. LLS produces high contrast underwater light field images, at millimeter to centimeter scale resolution and at two to five times the range of conventional video and photographic systems. Resolution and area covered by the images (swath width) vary with water clarity and tow height above the bottom.
To evaluate the capabilities and effectiveness of LLS technology for fisheries habitat research, NOAA’s West Coast & Polar Regions Undersea Research Center (NURP) and NOAA’s Office of Ocean Exploration co-sponsored a field test of a commercial LLS system for imaging a range of seafloor habitats. The interdisciplinary, inter-agency group of investigators was headed by Mary Yoklavich and Churchill Grimes (NMFS, Southwest Fisheries Science Center)**.
The test was conducted in the vicinity of the Big Creek Ecological Reserve off the coast of central California, in November, 2001. Water depth in the survey area ranged from 40 to 100 meters. This area had been previously surveyed by 100/500 kHz sidescan sonar and submersible video transects, and contained 4 different types of seafloor (rock outcrop, coarse sediment, fine sediment, sand) and two small canyons.
The LLS system was deployed for a total of 45 hours, towed at 2-3 knots at 3-9 meters above the seafloor. Under these conditions, the system imaged a swath of seafloor 4 to 13 meters wide. To evaluate the LLS's ability to detect disturbance to these habitats by fishing trawl gear, the sites outside the reserve were imaged both before and after trawling. Seafloor video from an ROV also was collected for comparison with the LLS. Because resolution of the LLS images varies with clarity of the water, the scientists also measured temperature, salinity and optical properties of the water column, to evaluate the performance of the LLS under various environmental conditions.
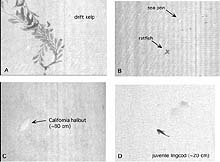
Laser line scan images of (A) drift kelp at 45 m water depth, swath width 2.7 m; (B) sea pen (arrow) and ratfish in water depth 90 m; (C) California halibut, swath width 4.3 m; and (D) juvenile lingcod over sand bottom (based on swath width, fish is about 20 cm). Fish identification is a best guess based on laser image profile and fishes collected in the vicinity. Click image for larger view.
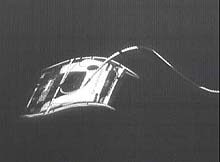
A laser line scan image of the Phantom II ROV. The laser line scan captures so much detail, that the printed words on the ROV (on the right hand edge, underneath the tube) can almost be read. Click image for larger view.
Preliminary results from this successful field test show that LLS technology does have potential for improving the efficiency and accuracy of fish habitat assessment. The LLS system did an excellent job at imaging details of the low relief sediments such as sand waves and ripples, as well as rock outcrops. These are vertical incidence (down-looking) images. One example shows an isolated rock outcrop with patches of large white sea anemones and groups of fishes, in about 60 m of water inside the Big Creek Ecological Reserve. Other laser images show several species of fishes, salp chains, sea anemones, sea pens, drift kelp and other macro-algae, etc., in relation to the seafloor. Preliminary identification of the fishes is based on image profile and fishes observed and collected in the vicinity. This type of detail is not possible with acoustic techniques (sidescan and multibeam sonar mapping), and affords the opportunity for scientists to investigate spatial relationships among fish, invertebrates, and the seafloor substrata to a degree that was not possible with other remotely sensed data.
**Principal Investigators: Mary Yoklavich and Churchill Grimes (NMFS, Southwest Fisheries
Science Center, Santa Cruz Laboratory)
Co-Investigators: Waldo Wakefield (NMFS, Northwest Fisheries Science Center) and Gary Greene (Moss Landing Marine Laboratories)
Additional participants: Science Applications International Corporation (SAIC); National Undersea Research Center at University of North Carolina Wilmington; Oregon State University
COAS Ocean Optics Group; University of New Hampshire Center for Coastal and Ocean Mapping
Sign up for the Ocean Explorer E-mail Update List.