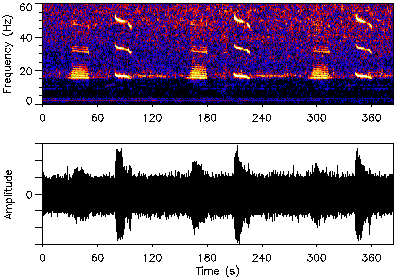
Spectrograms are a means of visualizing the energy and pitch of a particular sound. In the above example of a blue whale call, this spectrogram (upper image) plots time (horizontal axis) versus frequency (vertical axis), with warm colors representing high acoustic intensity. The first part of the call is a pulsive sound which varies little in frequency, and the second is a frequency-modulated moan, represented by the down-sweeping curve. Often, the spectrogram is accompanied by a time series plot of the sound(lower image), where time is plotted on the horizontal axis, and amplitude or “loudness” is on the vertical axis. Image courtesy of Sounds in the Sea 2001, NOAA/OER.
Related Links


