

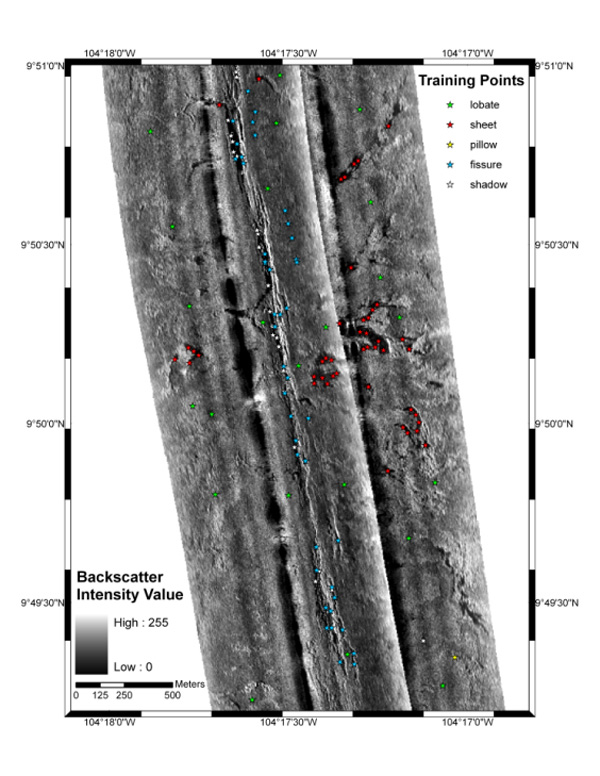
The chart above displays a section of sidescan sonar data with ground reference lava morphology classifications relating to different backscatter intensity values. Graduate student Jason Meyer is using data collected from the Medea camera sled and DLS 120 tow-sled to identify the distributions of seafloor morphology and structures along the Galapagos Spreading Center. He will take information about lava morphology, such as whether the dominant flows are lobate, sheet or pillow flows, and correlate it to backscatter intensity values collected by the side scan sonar on the DLS 120. Image courtesy of Jason Meyer; sidescan from NEMO 02 MV (White et al 2002).
Related Links
GalAPAGoS: Where Ridge Meets Hotspot
GalAPAGoS: Where Ridge Meets Hotspot - Dec 28 Log