

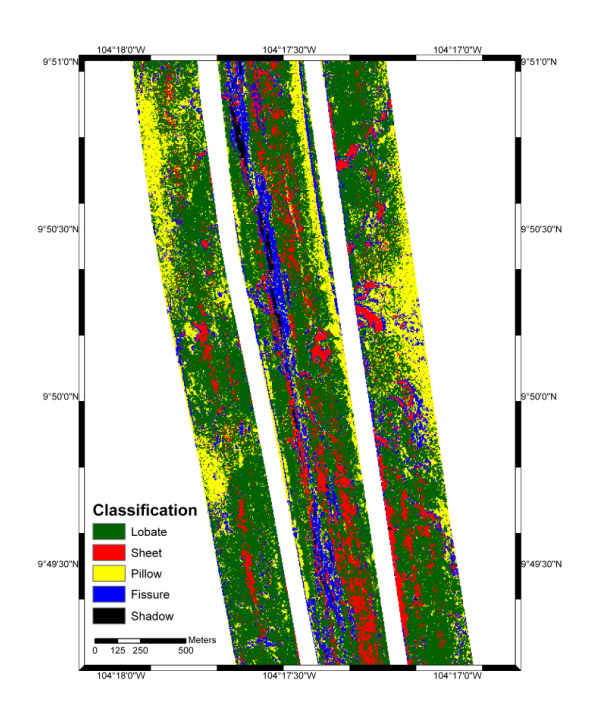
The chart above displays the same sidescan image that has been converted from processed sidescan data to be classified by lava morphology type, based on backscatter values correlating to particular types of lava morphology. Graduate student Jason Meyer is using data collected from the Medea camera sled and DSL 120 tow-sled on this cruise to identify the distributions of seafloor morphology and structures along the Galapagos Spreading Center. Image courtesy of Jason Meyer; sidescan from NEMO 02 MV (White et al 2002).
Related Links
GalAPAGoS: Where Ridge Meets Hotspot
GalAPAGoS: Where Ridge Meets Hotspot - Dec 28 Log