

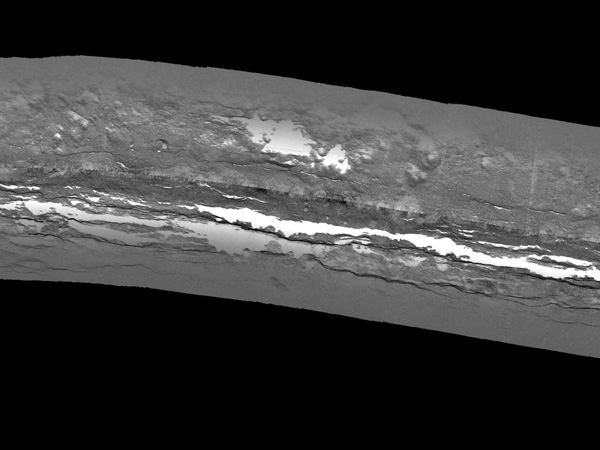
Once all variables are merged with the processed sound data, the complete dataset is georeferenced - converted from data with respect to time to data with respect to position. The final product is a grayscale image like the one seen above which can be used to make geological interpretations. In this image, the lighter colors display the weakest returned sounds, or shadows and less reflective surfaces, and the black are the strongest returns and harder surfaces. Image courtesy of UCSB, Univ. S. Carolina, NOAA, WHOI.
Related Links
GalAPAGoS: Where Ridge Meets Hotspot
GalAPAGoS: Where Ridge Meets Hotspot - Dec 20 Log
Download high-resolution image (jpg, 1.6 Mb)