

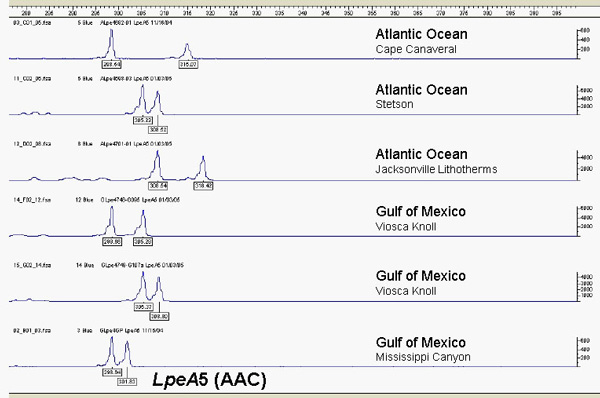
Fig. 3. Microsatellite alleles at the A5 locus for several Lophelia samples. The number of repeats of each ‘AAC’ allele is determined from the position of the peak, with larger fragments (more repeats) further to the right. Individuals shown are all heterozygotes since they have two peaks. Many loci are surveyed and a multilocus genotype is obtained for each sample. Image courtesy of C. Morrison/Ross et al./NOAA-OE
Related Links
Life on the Edge 2005 - Community Genetics