

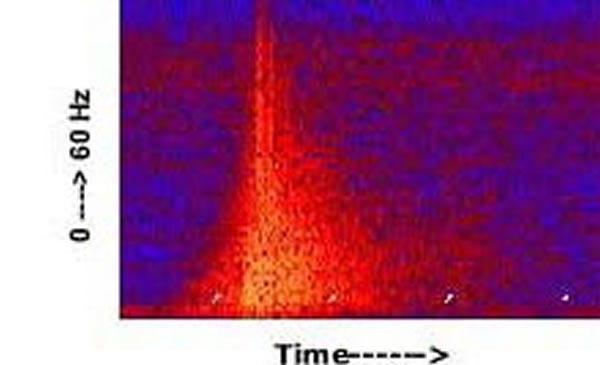
This diagram, called a spectrogram, shows the acoustic signal of an earthquake located near Astoria Canyon as recorded on a SOSUS hydrophone. The horizontal axis of the hydrophone record is time (white ticks are 1-minute intervals), the vertical axis is frequency (from 0 to 60 Hz), and the colors represent the varying strength of the earthquake's acoustic energy. Typically, an earthquake produces a triangular-shaped signal on a spectrogram with the highest acoustic energy (yellows and reds) occurring in the 5 to 30 Hz frequency range. Image courtesy of Submarine Ring of Fire 2002, NOAA/OER.