

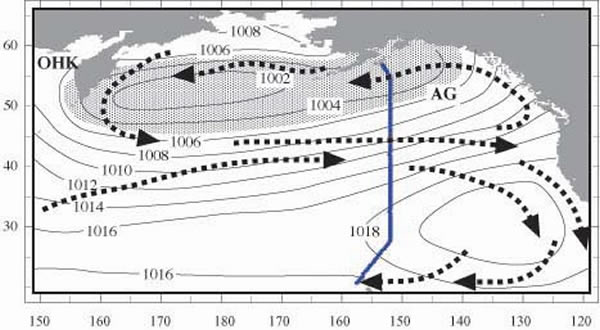
Generalized schematic of surface circulation (thick dotted lines) and winter (November-March) sea-level pressure (thin solid lines) of the North Pacific. SLP data is that derived from ship of opportunity measurements archived in the COADS database [daSilva, 1994]. The Aleutian Low as defined by the 1005mb contour is stippled. The sea of Ohkotsk (OHK) and the Alaskan Gyre (AG) are demarked. The blue symbols denote the cruise track of the R/V Thompson during the Marathon II expedition, results of which are shown in figure 4. Image courtesy of Exploring Alaska's Seamounts 2002, NOAA/OER.