Diagram showing how the bathymetry blanket corresponds to seafloor mapping data. A portion of the survey area covering the Mid Pacific Mountains is vividly represented in the bathymetry blanket by a shift to warmer colors for both the shallowest and deepest depths recorded in each vertical row, as well as a shallower average depth recorded in the relative location of the color change in each row of the blanket.
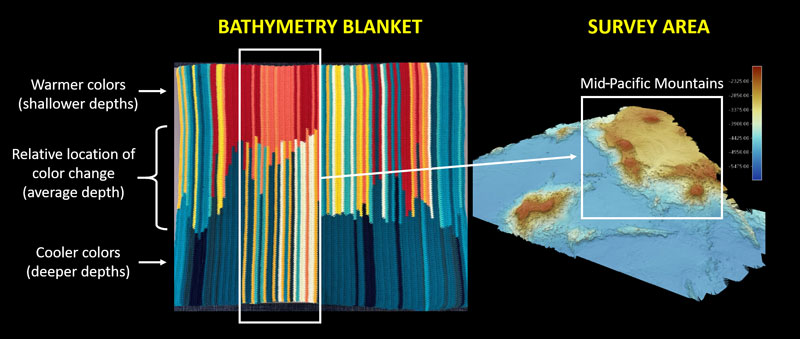
Bathymetry Blanket Diagram
Image courtesy of NOAA Ocean Exploration, Beyond the Blue: Johnston Atoll Mapping. Download larger version (jpg, 1.24 MB).
Diagram showing how the bathymetry blanket corresponds to seafloor mapping data. A portion of the survey area covering the Mid Pacific Mountains is vividly represented in the bathymetry blanket by a shift to warmer colors for both the shallowest and deepest depths recorded in each vertical row, as well as a shallower average depth recorded in the relative location of the color change in each row of the blanket.

Learn more