Tectonic Plate Boundary
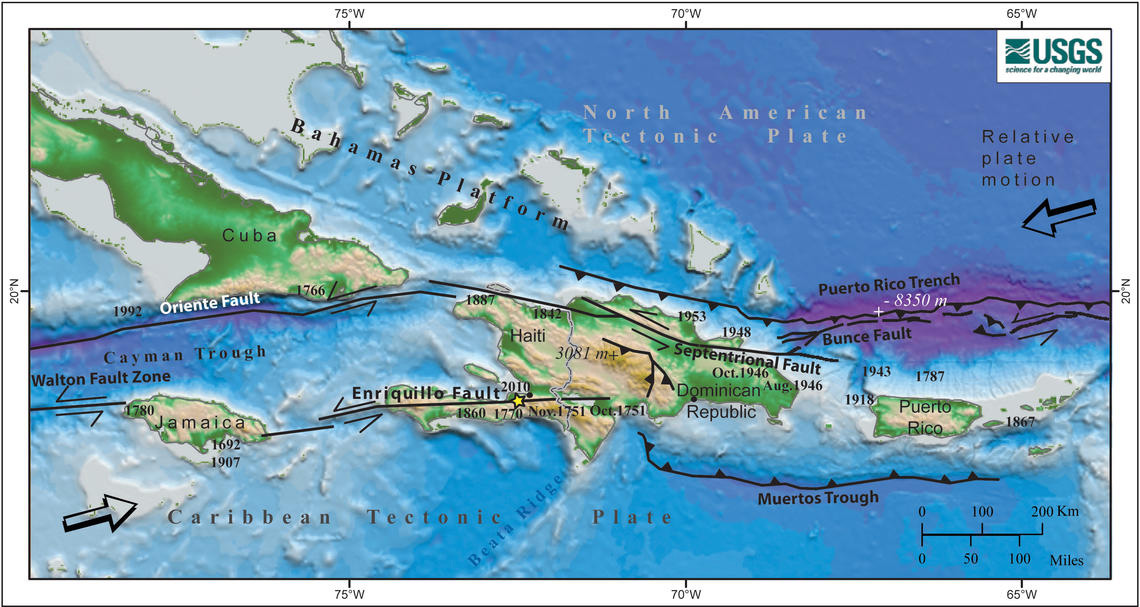
Map of the North American – Caribbean tectonic plate boundary. Colors denote depth below sea level and elevation on land. Bold numbers are the years of moderately large (larger than about magnitude 7) historical earthquakes written next to their approximate locations. Asterisk indicates the location of the January 12, 2010, Haiti earthquake. Barbed lines show the boundary where one plate or block plunges under the other one. Heavy lines with half arrows represent faults along which two blocks pass each other laterally.
 historical earthquakes written next to their approximate locations. Asterisk indicates the location of the January 12, 2010, Haiti earthquake. Barbed lines show the boundary where one plate or block plunges under the other one. Heavy lines with half arrows represent faults along which two blocks pass each other laterally. <em>Image courtesy of the U.S. Geological Survey.")