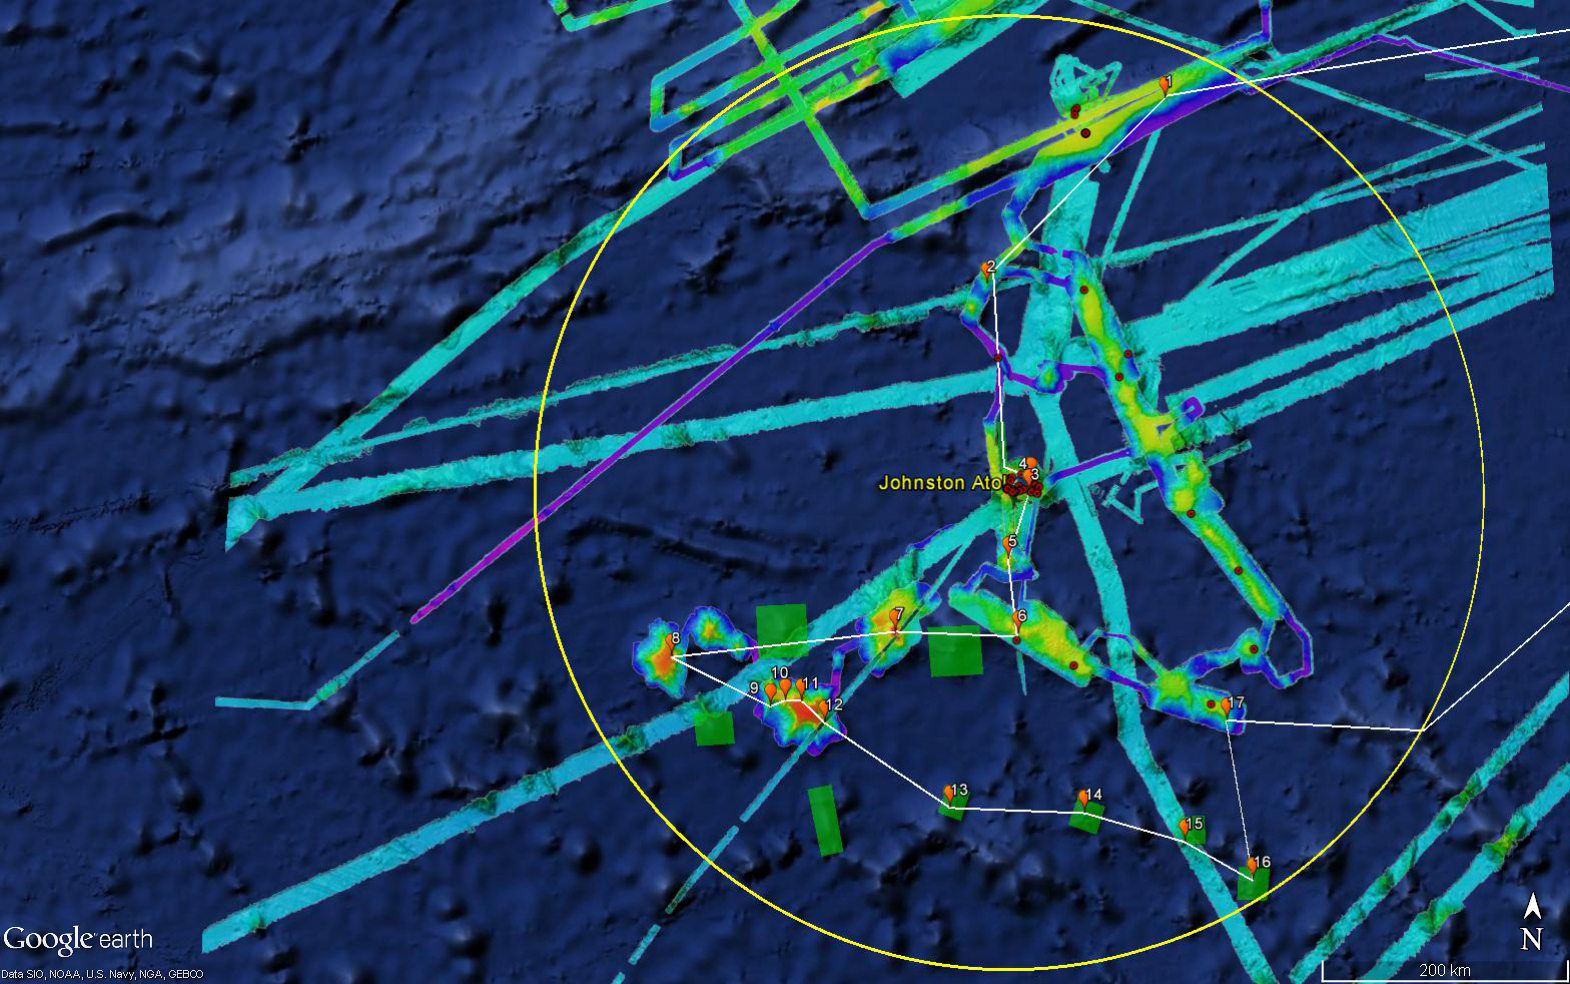
Expedition Map
Image courtesy of the NOAA Office of Ocean Exploration and Research, 2017 Laulima O Ka Moana.
Map showing expedition cruise plans with previous work in the region. The red dots are the locations where previous dives have been conducted using an ROV or submersible, and the orange dots are the locations of planned ROV dive sites for this expedition. The multicolored areas show publicly-available bathymetry data, color-coded by depth (yellow to purple showing shallow to deep). The green boxes are areas where we plan to conduct focused mapping operations during the expedition.
Download larger version (jpg, 1.2 MB).
. The green boxes are areas where we plan to conduct focused mapping operations during the expedition.")