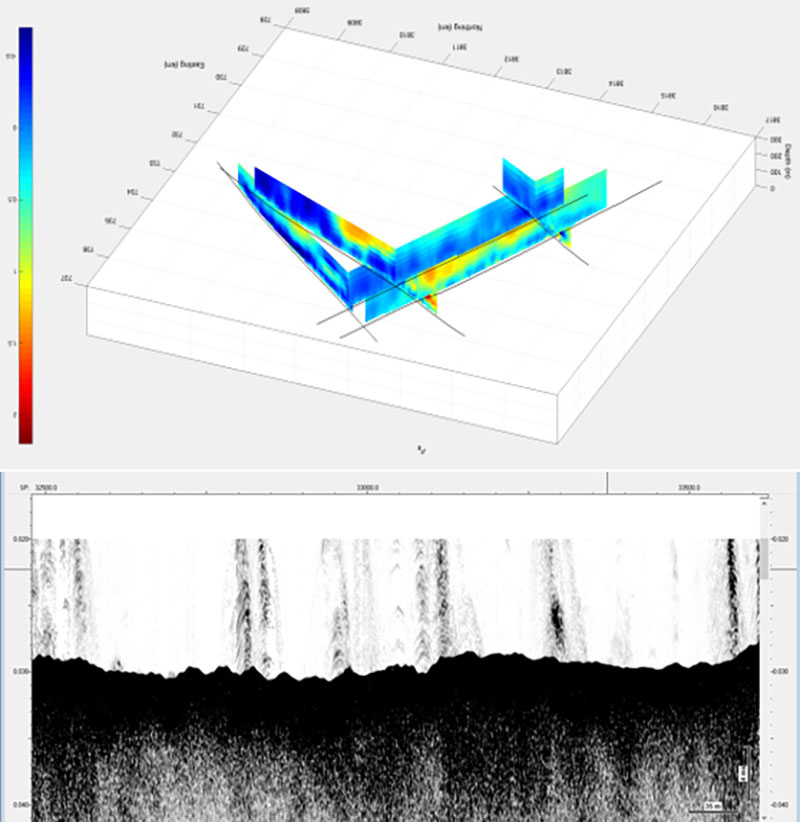
The upper image shows a fence plot of 2D resistivity from the CSEM survey lines off Point Conception. Warm warm colors indicate high resistivity, inferred to be hydrocarbon. The bottom image shows a section of sonar data along the same survey lines, with interesting “haystack” features. These areas with high resistivity that correspond to identified features in the sonar data will be targeted for possible sampling during the research expedition aboard Research Vessel Sally Ride.